
Official websites use .gov
A .gov website belongs to an official government organization in the United States.
Secure .gov websites use HTTPS
A lock (
) or https:// means you’ve safely connected to the .gov website. Share sensitive information only on official, secure websites.

Topics
Data & Maps
Surveys & Programs
Resource Library
Connecting Real Life Data to the U.S. Constitution for Students
As teachers across the nation prepare lesson plans for Constitution Day on September 17, they may want to tap into free U.S. Census Bureau resources and activities.
The Census Bureau’s Statistics in Schools (SIS) program offers a variety of materials designed to improve students’ civic and statistical literacy, including items exploring the link between the U.S. Constitution and the decennial census.
For Constitution Day, teachers can connect the census to our Founding Fathers, who envisioned an accurate count of our nation’s people.
Data are everywhere, from measuring our daily commutes and ranking our favorite sports teams to tracking the average income for a particular career and forecasting the weather. Knowing how to use and interpret data are key to making informed decisions, a valuable lesson to help students gain the skills for success.
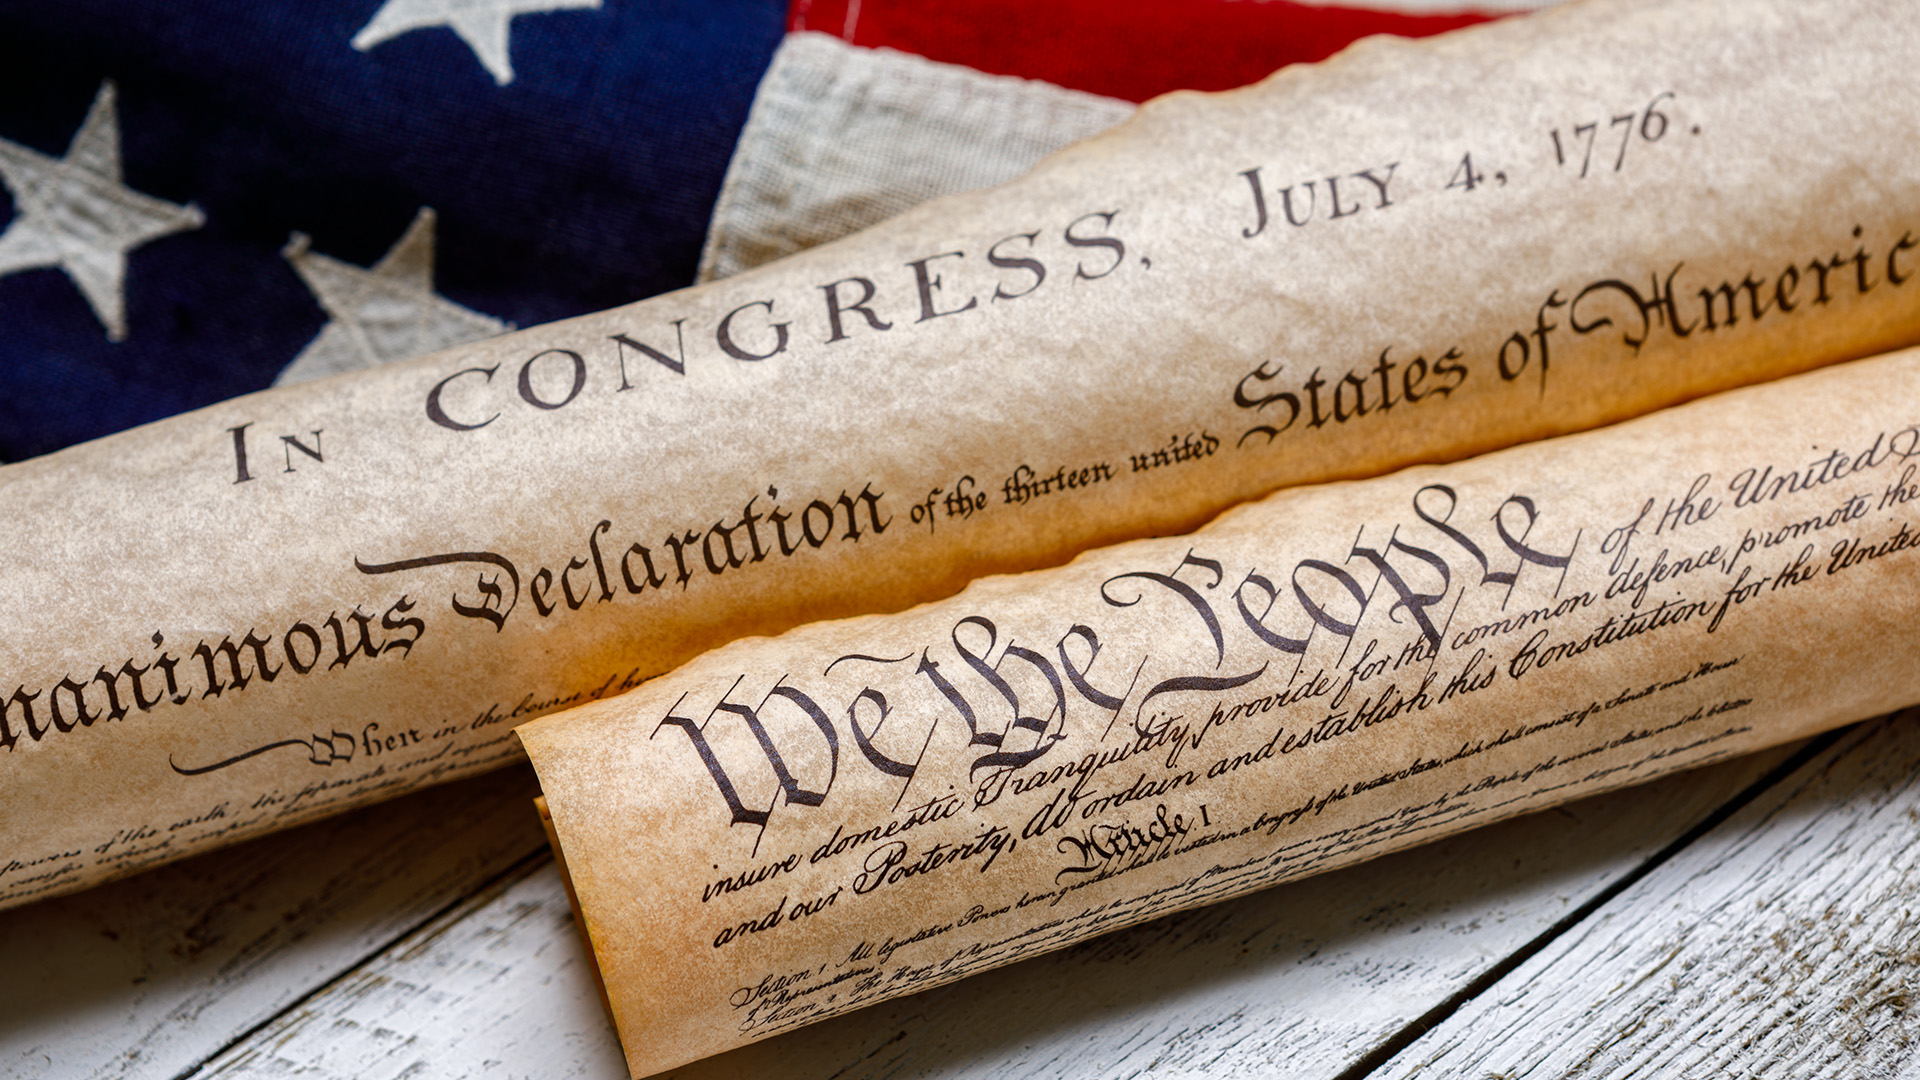
The Census and the U.S. Constitution
For Constitution Day, teachers can connect the census to our Founding Fathers, who envisioned an accurate count of our nation’s people. James Madison even suggested census takers ask additional questions that would help lawmakers better understand the needs of the nation, an early understanding of the importance of data.
The framers of the Constitution of the United States chose the population to be the basis for sharing political power, not wealth or land. Toward that end, they included a mandatory count of the population every 10 years (decennial census). Article I, Section 2 states: “Representatives and direct Taxes shall be apportioned among the several States which may be included within this Union, according to their respective Numbers….”
The first several decennial censuses were basic. Census takers asked a handful of demographic questions, processed and tabulated questionnaires at a local level and access to the results was relatively limited.
As the U.S. population grew, so did our need to collect more information on how our country was changing. Today, Census Bureau data help communities decide where public services like new schools, roads and hospitals are needed and help guide how trillions of federal dollars should be distributed to states and communities each year.
Free SIS Resources for Constitution Day
Constitution Day and Citizenship Day commemorate the 1787 signing of the U.S. Constitution. In addition to free teaching materials, the SIS page offers specific content on the role of the census and the Constitution.
Among them:
- Fun Facts. How many U.S. counties have names matching the last names of the signers of the Constitution who also served as U.S. presidents? Or what was the most populous urban area during the 1790 and 2020 censuses? The Fun Facts sheet about Constitution Day has the answers. Student-friendly handouts tie Census Bureau statistics to other holidays and observances, too, and are designed for different grade levels and across different subjects.

- Activities. Various other activities are also available to help students learn the significance of the U.S. Constitution and Constitution Day and the role the census plays in the apportionment of congressional seats. Each state’s number of seats in the U.S. House of Representatives is based on its population and is determined every 10 years after the census count.
- History Kahoot! Game. Did you know the U.S. population was 2.5 million in 1776? By 2020, it had ballooned 130 times to more than 330 million. Students can play SIS Kahoot! games to discover these and other historic data gems about America’s population and how the once-a-decade population count relates to the U.S. Constitution.

- Warm-Ups. How many U.S. representatives does your state have? Jump-start students’ day with 5-Minute Challenge warm-up activities on apportionment. Students can use an interactive data tool to explore more than a century’s worth of historical apportionment data for their state. Each takes approximately five minutes to complete, demonstrates the value of data and inspires discussion about a specific subject.
- Videos. Students can tune in to a visual explainer of the process of distributing the 435 congressional seats among the 50 states.
Statistics in Schools
Teachers can use SIS materials to supplement what’s already taught in the classroom and help students make the connection between data they use and the value of the census.
Teaching about your state? Check out the State Facts for Students Data Tool. Teachers can have students explore the tool or choose from seven activities that use the data to help students learn about their state as they collect, organize, analyze, map and graph a variety of information.
How about Hispanic Heritage Month? Students can explore Fun Facts and pull data about U.S. states with the largest Hispanic populations and the number of Hispanic-owned businesses across the nation. Or they can do a 5-Minute Challenge Warm-Up on the Hispanic or Latino population in their state.

Related Statistics
Subscribe
Our email newsletter is sent out on the day we publish a story. Get an alert directly in your inbox to read, share and blog about our newest stories.
Contact our Public Information Office for media inquiries or interviews.
-
PopulationWho Conducted the First Census in 1790?March 09, 2020Sixteen U.S. marshals, one territorial governor and their deputies counted 3.929,214 people in the nascent United States.
-
PopulationLooking Back 250 Years: The 1773 Boston Tea PartyDecember 14, 2023The Boston Tea Party led to the American Revolutionary War, the U.S. Constitution and eventually the first census count to ensure representation.
-
Population2020 Census To Help School Districts Prepare for Next Era of StudentsJuly 28, 2020An accurate count of children can help communities meet the need for more educational resources, including new schools.
Education
Boosting Civic Literacy in the Classroom for Constitution Day
Teachers can use free Statistics in Schools (SIS) activities page to connect the census to the U.S. Constitution that calls for a population count each decade.
Population
How COVID-19 Changed Older Adults’ Work and Lifestyle
New data visualization shows differences in older adults’ work and lifestyle patterns from 2019 to 2022.
Business and Economy
How Many Business Start-Ups in Puerto Rico?
For the first time, the Census Bureau is releasing monthly data on new business applications in Puerto Rico.
Health
Mental Health Struggles Among Older Adults During the Pandemic
The Census Bureau’s Household Pulse Survey shows older adults’ mental health and well-being varied by socioeconomic characteristics.
Page Last Revised - September 4, 2024
✕
Is this page helpful?
 Yes
Yes
 No
No
 Yes
Yes
 No
No✕
NO THANKS
255 characters maximum
 255 characters maximum reached
✕
Thank you for your feedback.
Comments or suggestions?

Comments or suggestions?