New Data Visualization Reveals Changes in Ways Older Adults Lived and Worked Before and in the Aftermath of the Pandemic
Older adulthood is often associated with economic and social transitions, including retirement, becoming a grandparent, and changes to health. And this decade, the COVID-19 pandemic brought about even more pronounced societal transformations.
The visualization also presents dynamic time-series graphs of recent trends in employment and working from home from 2015 to 2022.
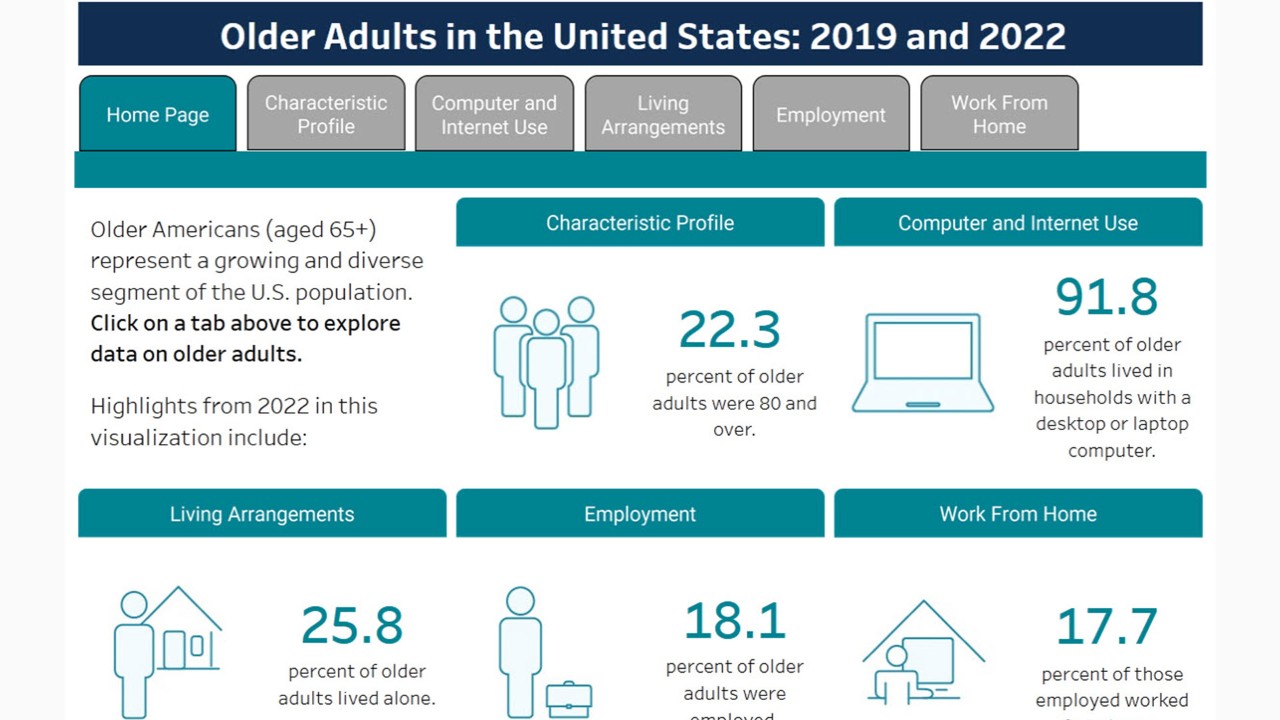
A new U.S. Census Bureau data visualization explores changes across different social characteristics of older adults from 2019 to 2022, a year before the pandemic emergency officially ended, including: computer and internet use; living arrangements; employment; and working from home.
In 2022, 15.6% of employed adults ages 55 to 74 worked from home, compared to just 7.7% in 2019. This rate exceeded 20% in Washington, D.C. (32.7%); Colorado (23.3%), Washington (21.8%), and Arizona (21.5%).
Rates of working from home also varied by social characteristics among employed adults ages 55 to 74.
For example, 24.4% of those with a bachelor’s degree or higher worked from home in 2022, compared to 6.8% of those with less than a high school degree.
Computer ownership among older adults changed, too. In 2022, 91.8% of adults age 65 and older owned a computer, up 5.6 percentage points from 2019. This suggests that older adults were increasingly using computers for their jobs, entertainment and to communicate with family and friends.
Computer ownership varied by state, ranging from 96.0% in Utah to 85.3% in West Virginia.
Note: Select the image to go to the interactive data visualization.
These statistics are among a trove of data available in this new visualization based on the Census Bureau’s American Community Survey (ACS) 1-year estimates. This visualization also provides some of the same comparisons that a previous visualization showed for young adults.
The landing page displays highlights of each page: a characteristic profile; computer and internet use; living arrangements; employment; and working from home. The characteristic profile provides some general estimates of the population age 65 and over, while the other pages provide a deeper dive into each topic.
All four topic pages have a dynamic graph that lets users explore a variety of characteristics as well as the percentage point change from 2019 to 2022.
Drop-down menus allow users to change the characteristics and age groups.
Other highlights: maps showing the share of employed older adults working from home, computer ownership and broadband internet subscription by state. The visualization also presents dynamic time-series graphs of recent trends in employment and working from home from 2015 to 2022.
Related Statistics
Subscribe
Our email newsletter is sent out on the day we publish a story. Get an alert directly in your inbox to read, share and blog about our newest stories.
Contact our Public Information Office for media inquiries or interviews.
-
Population2020 Census: 1 in 6 People in the United States Were 65 and OverMay 25, 2023The U.S. population age 65 and over grew from 2010 to 2020 at fastest rate since 1880 to 1890 and reached 55.8 million, a 38.6% increase in just 10 years.
-
Income and PovertyMajority of Older Adults in Poverty in 2021 Lived AloneJune 25, 2024New Census Bureau report explores demographic characteristics, living arrangements and income sources of older adults living in poverty.
-
PopulationOlder Population Grew in Nearly All U.S. Metro AreasJune 27, 2024New 2023 metro area population estimates by age show increases in older adults in almost all metro areas, with decreases in young people in many metro areas.
-
EmploymentU.S. Workforce is Aging, Especially in Some FirmsDecember 02, 2025Firms in sectors like utilities and manufacturing and states like Maine are more likely to have a high share of workers over age 55.
-
PopulationTribal Casinos: An Economic BoonNovember 20, 2025A new study explores how tribal casino expansion in the 1990s and 2000s affected poverty, jobs and income for American Indian communities and their neighbors.
-
NAICS Sector 31-33 ManufacturingSome Less Populous States Have High Manufacturing Revenue Per CapitaSeptember 29, 2025Today is the start of a week of celebrations at the Census Bureau marking the 14th annual Manufacturing Day on October 3.
-
Families and Living ArrangementsCouples’ Finances: Married but SeparateSeptember 24, 2025While most married couples had joint bank accounts, fewer shared all their financial accounts.


