Most Goods Americans Use in Their Daily Lives Are Transported and Delivered by Truck
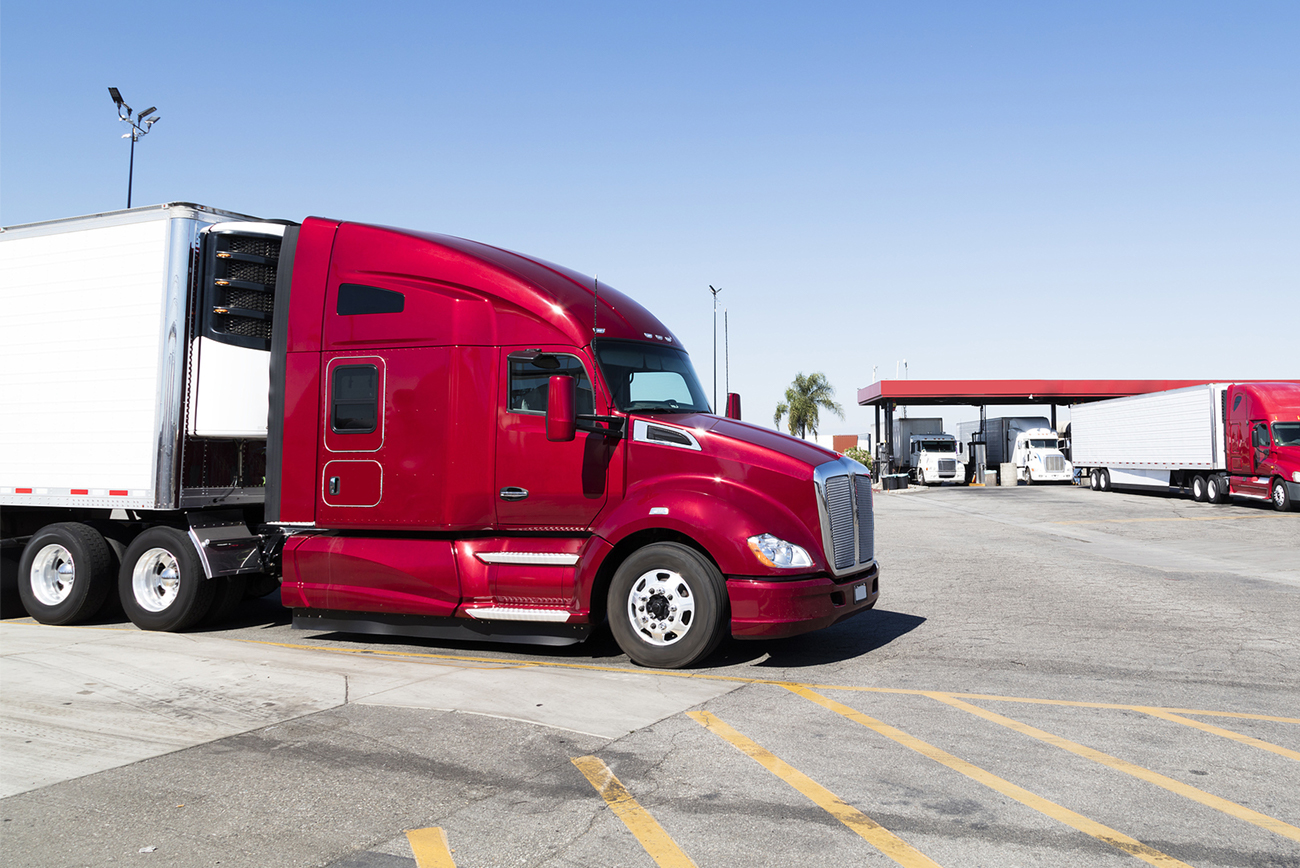
We see them on roads and highways across the country, those large tractor trailers hauling goods near and far and lined up at weigh stations. Sometimes what they’re carrying is obvious from the signage and logos on the outside but often all we see is a box on wheels.
We can’t help but wonder: What’s inside? How heavy is it? Where did it start its journey and where will its journey end? And how important is that truck and its load to the national and local economies?
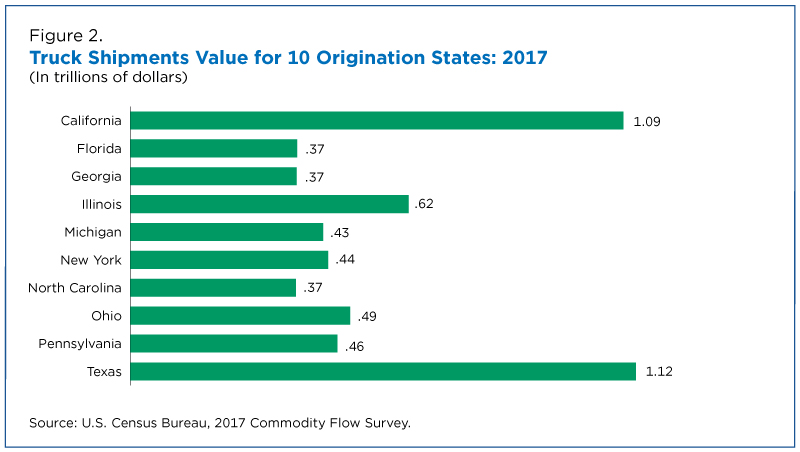
Truck shipments that originated in Texas and California led the nation in the value of goods shipped. Both states shipped over $1 trillion of goods in 2017.
Want the answers? Check out the U.S. Census Bureau’s Commodity Flow Survey (CFS), sponsored by and in conjunction with the Bureau of Transportation Statistics.
Conducted every five years, this sample-based survey produces detailed estimates on the movement of commodities in the United States. Data are shown by mode of transportation, weight, commodity and distance shipped.
The survey includes measures of the shipments’ value and weight and even data on commodity exports and temperature-controlled shipments.
These statistics highlight just how much we rely on these truck shipments in our day-to-day lives.
Trucks Carry Trillions of Dollars of Goods
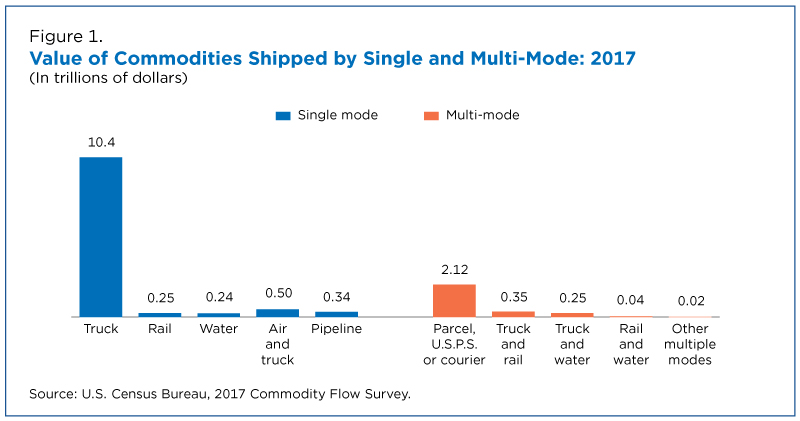
According to the CFS, trucks transported 71.6% or $10.4 trillion of the $14.5 trillion of the value of all goods shipped in the United States in 2017, the latest year for which statistics are available.
Truck shipments that originated in Texas and California led the nation in the value of goods shipped. Both states shipped over $1 trillion of goods in 2017.
Texas also led the nation in the total weight of truck shipments, transporting nearly 1.3 billion tons of goods in 2017. California was second with 580.6 million tons.
Texas also led the nation in other shipment modes, including rail and pipeline, but even the largest of these, pipeline, accounted for only $121.0 billion of the total of all shipping modes.
California led the nation in other modes, including parcel, U.S. Postal Service or courier, with shipments valued at $350.2 billion.
Who Owns Those Trucks?
The CFS also publishes data based on truck owners, providing insight into the importance of small businesses to trucking.
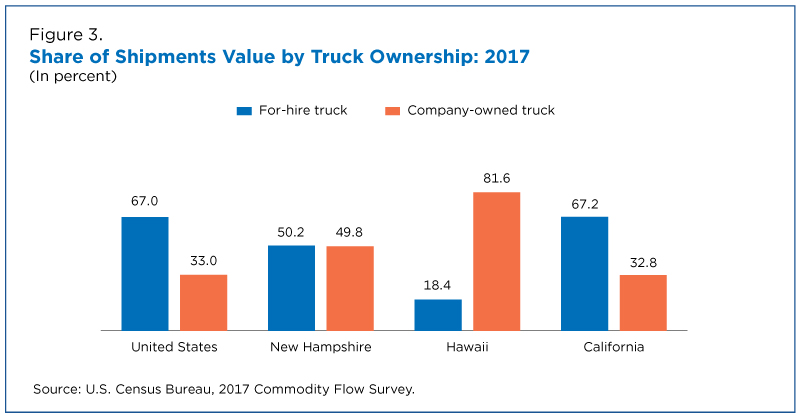
Nationally, about two-thirds of the value of all truck shipments in 2017 were transported by for-hire trucks. Truck shipments from California mirror this national average.
However, the data vary widely by state. In some states, like New Hampshire, the share was close to 50/50 while in others, like Hawaii, company-owned trucks dominated.
How Far do Trucks Transport Goods?
Tennessee was among the nation’s leaders in terms of the average number of miles (416) that goods were shipped from the state in 2017.
Nationally, the average miles per truck shipment in 2017 was 206 miles, compared to 679 miles for all modes and, not surprisingly, 1,403 miles for goods shipped by air (which includes commodities shipped by both truck and air).
The CFS not only produces these data on the state the shipment comes from but also its final destination state.
License plates of trucks we see on the highway seem to indicate that these goods travel long distances but that’s not the case: 39.0% of the value and 65.0% of the weight of all goods shipped by truck traveled less than 50 miles.
Across all shipment modes, 35.3% of the total value of all shipments and 57.9% of the shipment tons in 2017 traveled less than 50 miles from the start to the end of their journey.
However, like truck ownership, the share of the value of shipments by distance shipped varied widely by state.
For example, the proportion of the value of shipments from Tennessee that went 50 or more miles by truck in 2017 is greater than the proportion for the U.S. as a whole.
How Many Pounds of Goods Are Transported?
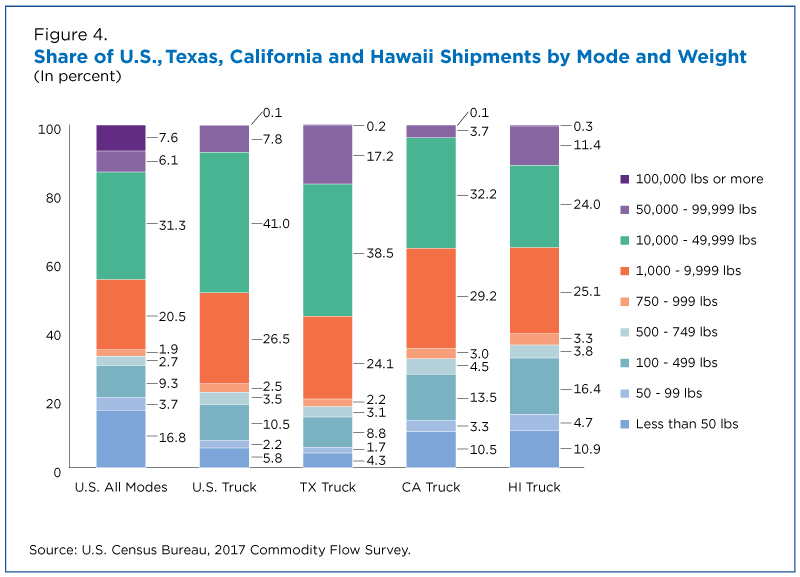
Nationally, shipments that weighed between 10,000 and 49,999 pounds accounted for the largest share of the shipments value (31.3%) and weight (40.6%) for all shipment modes in 2017. This weight range also accounted for the largest share of truck shipments, with 41.0% of the value and 55.6% of the tons.
However, as with the distance shipped, these average shipment weights varied widely by state in 2017.
For some states like Texas, heavier shipments made up a larger share of the shipments’ value than the national average, In other states like California and Hawaii, lighter shipments made up a large share of the total shipments’ value.
What Goods Are Shipped by Truck?
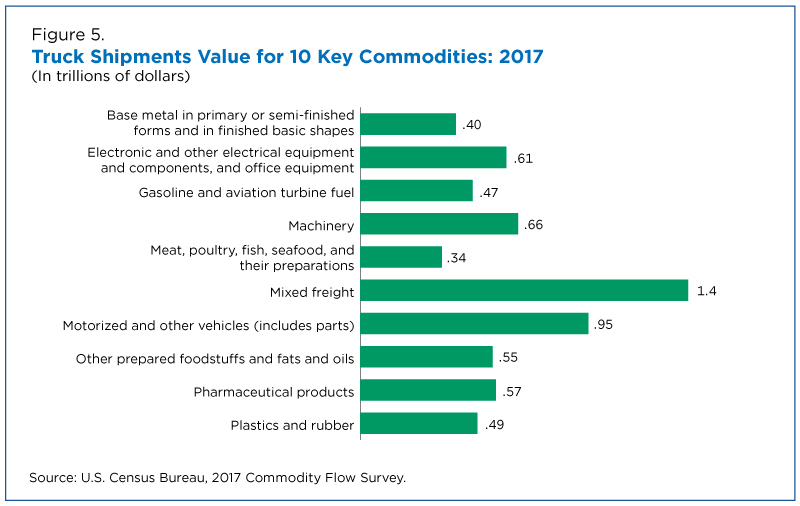
Across all modes, “Mixed Freight” made up the largest share of the shipments value ($1.4 trillion of $14.5 trillion) while “Gravel and Crushed Stone” made up the largest share of the shipments by weight (1.6 billion tons of 12.5 billion total tons) in 2017.
Mixed freight was also the top commodity in terms of value of shipments by truck, with 94.4% shipped by truck. The gravel and crushed stone category topped truck shipments in 2017 with 1.4 billion of the 1.6 billion tons of this commodity shipped by truck.
While the CFS produces detailed data on truck shipments by commodity, it also provides data specifically on temperature-controlled shipments. These refrigerated (and similar) trucks transport goods that are a vital component of our economy, such as produce and meats.
The CFS data show that “Other Prepared Foodstuffs and Fats and Oils” made up a large share of the total shipments weight. In 2017, 129.0 million tons of these goods were shipped in temperature-controlled trucks but mixed freight was still the top-ranking commodity with 195.7 million tons.
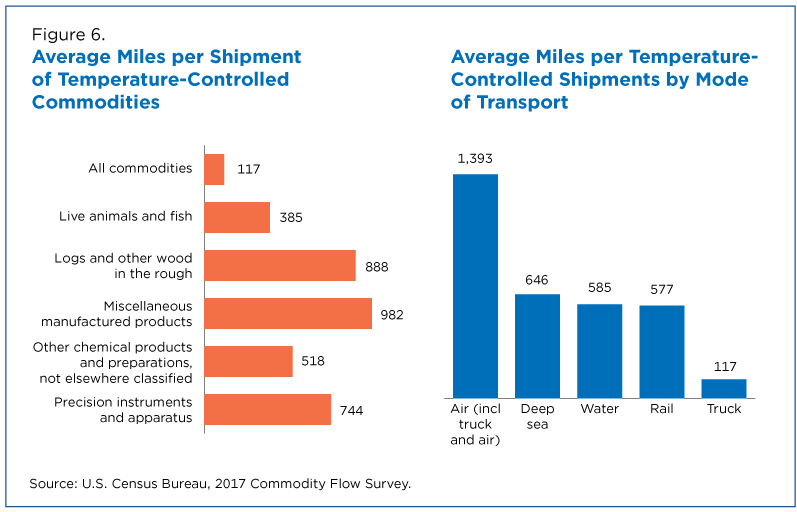
The graph below shows that “Miscellaneous Manufactured Products” shipped by truck traveled an average of 982 miles in 2017, well above the average of 117 miles for all commodities. Temperature-controlled goods transported by air traveled 1,393 average miles per shipment.
Census Detail Image - Component

Census Image - Component
External Image - Component

Production Image
With the surge in the popularity of online orders for food and other items, the future of temperature-controlled transportation statistics promises to be ever-changing.
Exports by Truck
The CFS also documents the movement of goods for export.
Exports’ shipment value for all commodities for all transportation modes declined 4.5% and exports shipments by truck fell 9.3% from 2012 to 2017. Export activities by rail decreased by about 25.1%.
Exports for company-owned trucks experienced the larger share of this decline in truck exports, down 66.7%.
“Motorized and Other Vehicles” were the highest-value exports shipments at $49.4 billion in 2017.
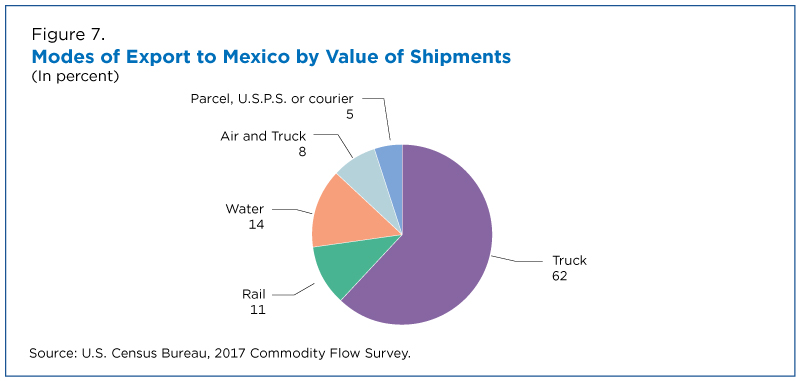
Where do these exported goods go? Canada was the No. 1 recipient of exports by truck in terms of value of shipments ($138.3 billion), followed by Mexico with $71.4 billion in export shipments in 2017.
For-hire trucks carried the larger share ($131.3 billion) of the shipments’ value into Canada; company-owned trucks delivered the remainder of these Canadian export shipments.
More Trucking Data
All of the geographic, export and temperature-controlled data presented in this story (plus much more CFS data) are available at data.census.gov.
In addition to the CFS, the Census Bureau has a wide array of data to offer on trucking from more than 50 other programs. For example, our International Trade program collects data on imports and exports for selected commodities.
Our North American Products Classification System (NAPCS) details products and services provided by U.S. businesses, including key manufactured products that are often transported by trucking firms. The data.census.gov dissemination platform shows NAPCS products and services and 2017 Economic Census products data.
If you are interested in statistics on the drivers of these trucks, check out the industry and occupation data available from the American Community Survey at data.census.gov and this America Counts story.
Note: All comparative statements made in the text of this story have undergone statistical testing and are significant at the 90-percent confidence level. Comparisons shown in the tables and graphics have not been tested for statistical significance and, therefore, should be interpreted with caution. Differences between estimates may be attributed to sampling or nonsampling error, rather than to differences in underlying economic conditions. Caution should be used in drawing conclusions from the estimates and comparisons shown. Additional information on the survey methodology, including sampling error and nonsampling error, may be found on the CFS website.
All dollar values are expressed in current dollars, i.e., they are not adjusted for price changes.
Andrew W. Hait is a survey statistician/economist at the Census Bureau.
Lynda Lee is a supervisory statistician at the Census Bureau.

Redistricting & Voting Rights Data Office (RDO)
Visualizations

2020 Census Demographic Data Map Viewer is a web map application that includes state-, county-, and census tract-level data from the 2020 Census.
Data
Fact Sheets
Blog Posts
Newsroom
Census Academy
View training resources for 2020 Census data.
Videos
Maps
-
2020 Census Demographic Data Map ViewerThe 2020 Census Demographic Data Map Viewer is web map application that includes state, county, and tract-level data from the 2020 Census.
-
2020 Census P.L. 94-171 Redistricting Data Map SuiteHere you will find the 2020 Census P.L. 94-171 Redistricting Data Map Suite
-
TIGER/Line ShapefilesView all the available mapping files from the Geography program.
Story Ideas and Statistics
Subscribe
Our email newsletter is sent out on the day we publish a story. Get an alert directly in your inbox to read, share and blog about our newest stories.
Contact our Public Information Office for media inquiries or interviews.
-
America Counts StoryAmerica Keeps on Truckin’June 06, 2019More than 3.5 million people are truck drivers, an all-time high. Driving trucks is one of the largest occupations in the nation.
-
America Counts StoryThe 2018 Annual Survey of Manufactures Is OutJune 23, 2020The first Annual Survey of Manufactures in more than two years is now available. An infographic outlines total value of shipments and payroll in the sector.
-
America Counts Story2017 Economic Census Data Breaks Out Industry Growth, Changes By StateNovember 05, 2020State and local data from the Census Bureau’s 2017 Economic Census provide insight into the businesses that are vital to our economy.
-
PopulationMeasuring Foreign-Born Population Over Nation’s 250-Year HistoryJuly 21, 2026Historical census data document changes in the foreign-born population in both numbers and countries of origin.
-
Business and EconomyA Road Trip Across the Vacation EconomyJuly 14, 2026The Census Bureau rings in the summer with a travel statistics road map.
-
HealthWhere You Live Matters for Your Health and So Does How We Measure ItJuly 09, 2026Census Bureau research helps policymakers and researchers identify the most reliable ways to predict health outcomes and distribute resources accordingly.
-
PopulationU.S. Fertility Continues to Drop but Still High in Some CountiesJune 25, 2026Counties with the highest numbers of births have some of the lowest fertility rates.