Number of Truckers at All-Time High
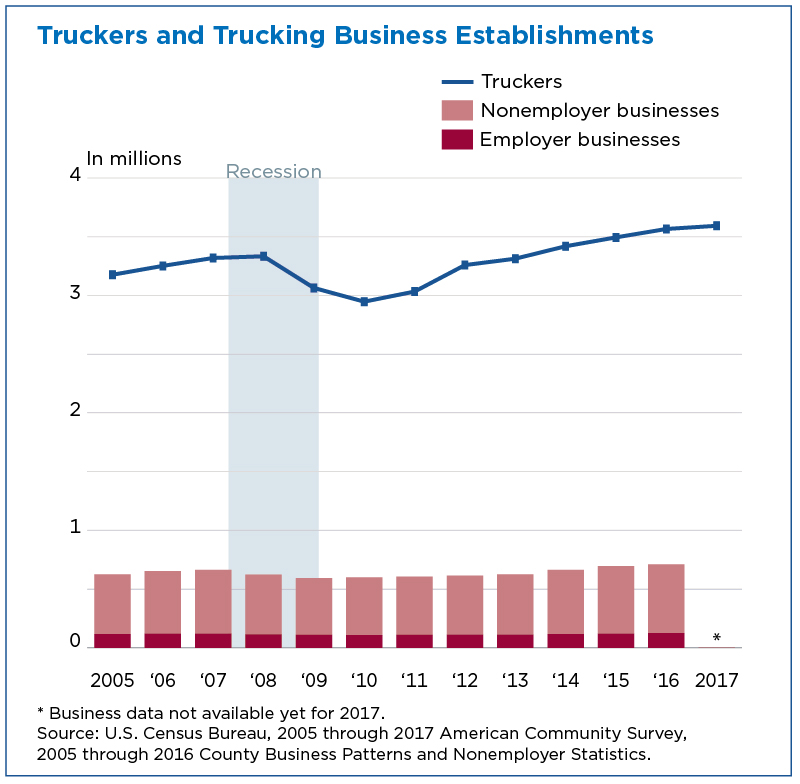
The trucking industry has bounced back from its decline during the recession and the number of truck drivers is at an all-time high.
In 2016, the number of employer and self-employed (nonemployer) trucking businesses reached 711,000, surpassing the pre-recession high.
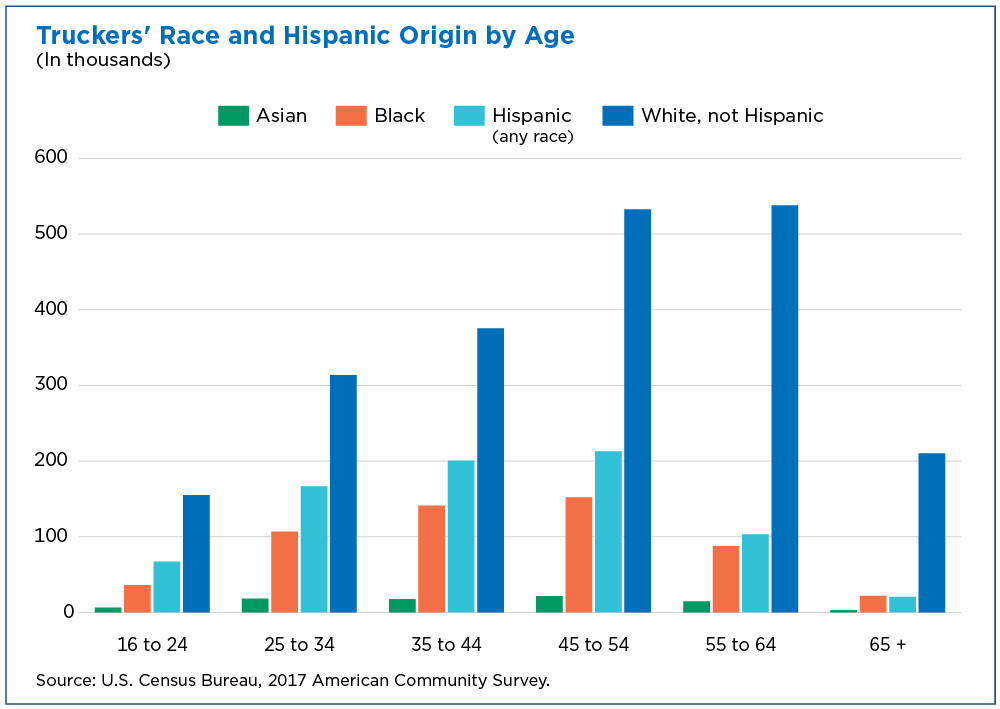
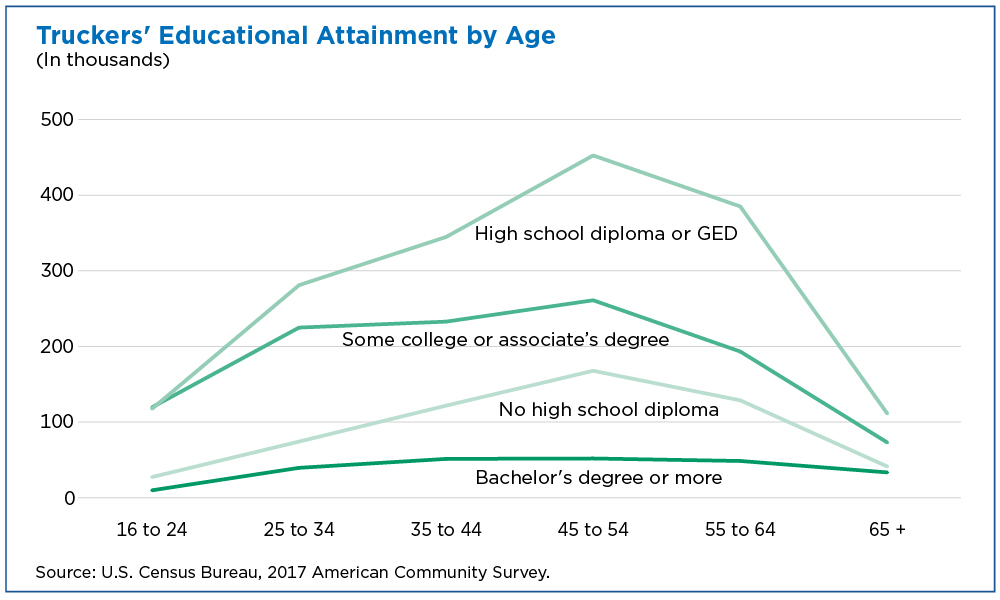
Among younger truckers under age 35, more of them are women, Hispanic and more educated than their older counterparts age 55 and older.
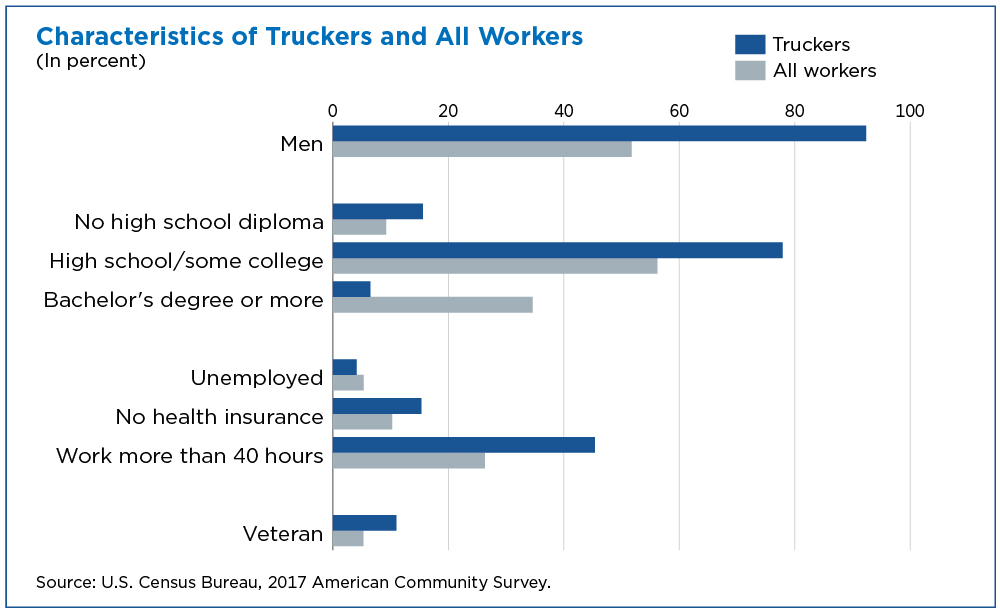
More than 3.5 million people work as truck drivers, an occupation dominated by men who hold more than 90% of truck driving jobs. Driving large tractor-trailers or delivery trucks is one of the largest occupations in the United States.
Who’s Behind the Wheel?
Truckers are older on average than other workers. Their median age is 46 compared with 41 for all workers.
They also have lower than average educational attainment (7% have a bachelor’s degree versus 35% for all workers).
Despite this, truckers are less likely to be unemployed than other workers (4.1% unemployed versus 5.3% for all workers) but they are also less likely to have health insurance (15% uninsured versus 10% for all workers).
Although many truckers work a regular 40-hour workweek, almost half of truckers work longer hours. In comparison, about a quarter of workers in all occupations work more than 40 hours a week.
On average, truck drivers working full time, year-round, earn about $43,252 annually, lower than the median for all full-time workers ($47,016), but exceed those of other blue-collar jobs.
At least one in 10 truckers are veterans, double the rate of workers in general. Even accounting for its large proportion of men and older workers, truckers still outpace other occupations as a destination for veterans.
Truckers are also more likely to have a disability than other workers. Even looking at just the older workforce, truckers are more likely than other workers age 55 and older to have a disability.
The New Face of Trucking
Among younger truckers under age 35, more of them are women, Hispanic and more educated than their older counterparts age 55 and older.
They are more likely to be high school graduates and have some college education.
They’re also more urban. The percentage of young truck drivers coming from rural areas is about half that of older truckers, with fewer than 20% of younger truckers living in rural areas.
The Big and Small of Trucking
Truckers can work in many industries. For example, truckers can be employed by a trucking firm or by a supermarket delivering groceries to customers’ homes. However, about a third work for businesses in the Truck Transportation Industry, classified in the North American Industry Classification System (NAICS) as code 484.
Over 2 million people work in the truck transportation industry, which not only employs truck drivers but also mechanics, managers, dispatchers and workers in other occupations.
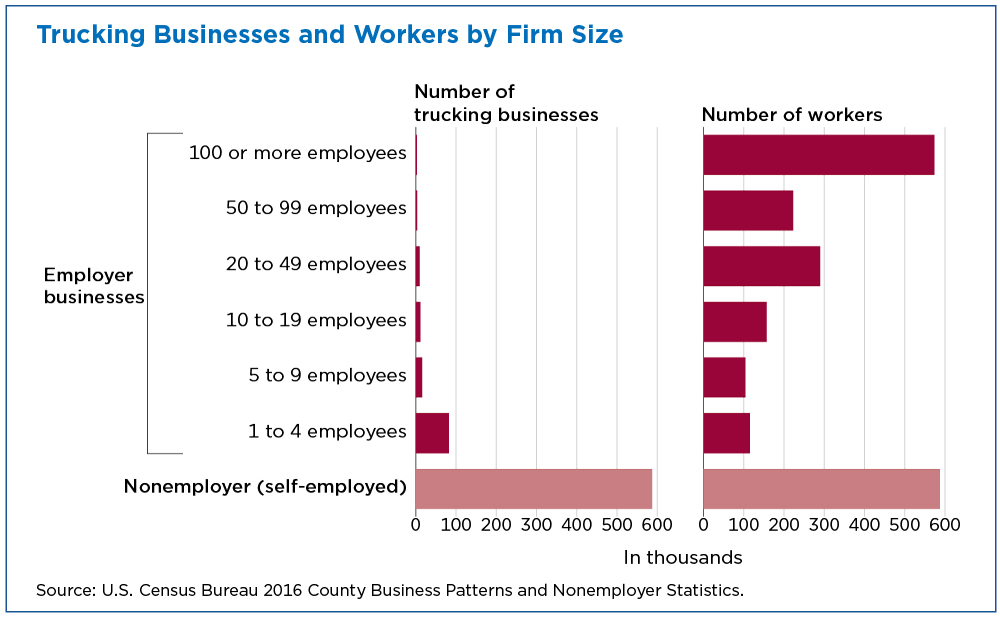
Nearly 1.5 million people work for the 124,320 employer businesses in this industry, and another 587,000 are self-employed, or “nonemployers”
These nonemployers (assuming one person per business) make up nearly 29% of the workers in the industry. Another 32% work for smaller firms that have fewer than 50 employees.
The Economic Engine of Trucking
Between 2012 and 2016, the number of trucking businesses grew 15.9%, outpacing total growth across all industries (8.0 percent).
This translates into an increase of 200,000 workers in the trucking industry during that time period. About four in 10 new workers are self-employed.
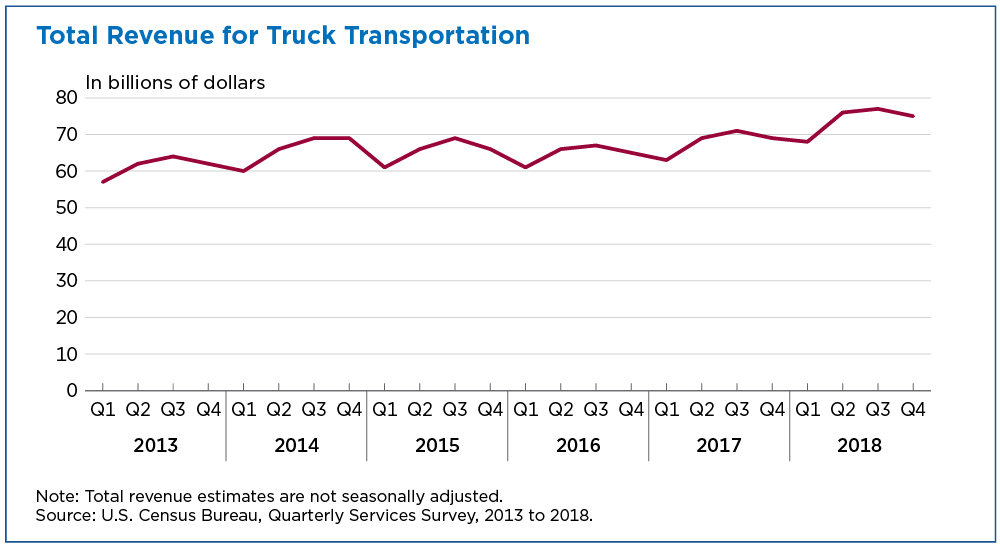
Trucking provides a critical infrastructure for economic activity. Trucking business revenues mirror the seasonality of the goods they transport, hitting a peak typically during the third quarter as retailers prepare for the holiday season.
In 2018, revenue for trucking firms rose to $77.0 billion in the third quarter before falling 2.7% to $75.0 billion in the fourth quarter. (These data are not seasonally adjusted.)
In It for the Long Haul
The semis and 18-wheelers you see on your commute could be delivering goods from one neighborhood to another or all the way across the country.
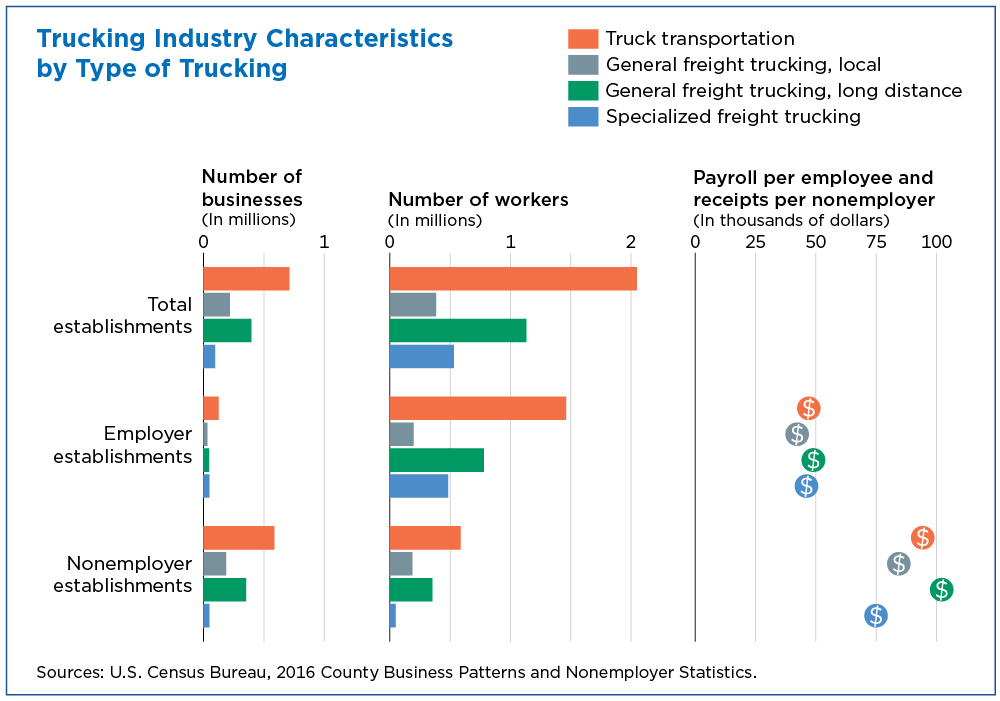
More than half of the 711,355 employer and self-employed trucking businesses are classified as long-distance (NAICS 48412, 396,898 businesses), with 88 percent (351,821) self-employed truckers.
Independent, self-employed trucking businesses are not only important in the long-distance segment but with Specialized Freight Trucking businesses too, where nearly half of the 96,011 total businesses are self-employed.
Specialized Freight Trucking include businesses that transport goods which have an unusual size, shape, or weight, such as wind turbines, and require specialized equipment.
Average payroll per employee in the long-distance industry is higher than for local or specialized trucking businesses ($48,920 versus $42,203 and $46,084, respectively).
Among independent truckers, long-distance trucker’s average revenue is higher, too.
While this revenue does not factor in the costs of operating their business, their average revenue of $102,000 is greater than the average annual revenue for other trucking nonemployer businesses. It is also notably higher than many nonemployer businesses in other industries.
Who owns trucking businesses?
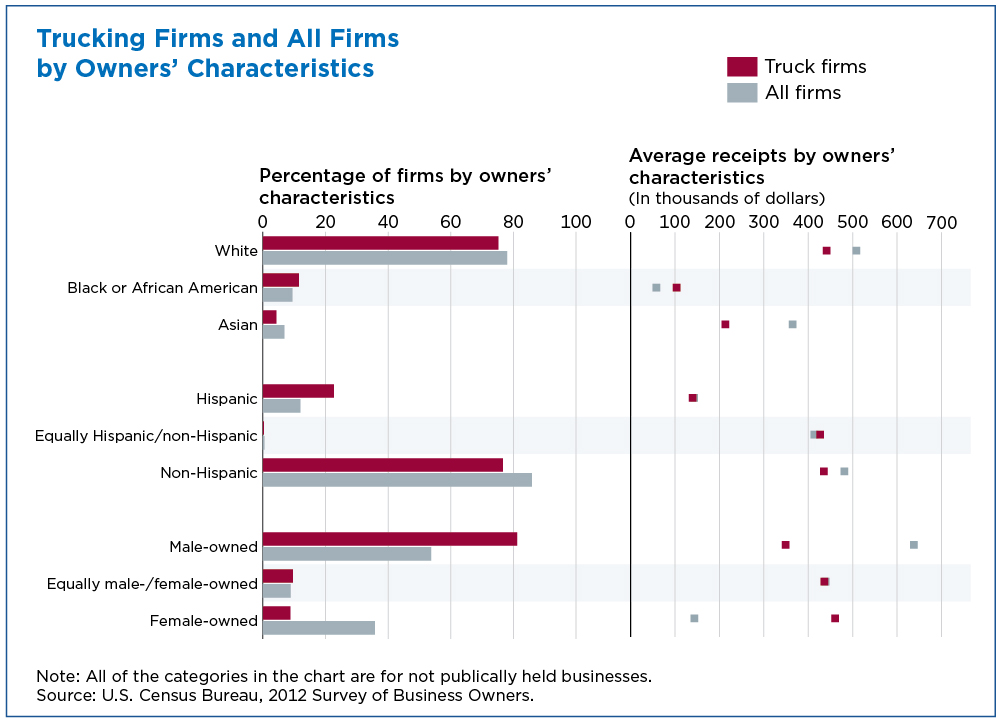
Ownership of these trucking businesses mirrors the characteristics of the drivers themselves. About 75% of all businesses are white-owned, accounting for 66% of all trucking business revenue.
The average receipts for White-owned trucking firms is about double that of black-owned or Asian-owned firms.
Women-owned trucking firms are less common (less than 10%) but they have an average revenue higher than those owned by men — an average of about $460,000 per firm versus about $349,000.
More than ever, truckers and the trucking industry move goods across the country and within our towns and neighborhoods. As the trend towards e-commerce continues, the trucking industry and its workers will continue to provide a critical infrastructure for our nation.
Statistics in this story are from the 2017 Tables on Characteristics of Drivers and Sales Workers and Truck Drivers based on data from the American Community Survey and the 2016 County Business Patterns and Nonemployer Statistics, Quarterly Services Survey, and 2012 Survey of Business Owners.
Related Statistics
Subscribe
Our email newsletter is sent out on the day we publish a story. Get an alert directly in your inbox to read, share and blog about our newest stories.
Contact our Public Information Office for media inquiries or interviews.
-
EmploymentWhat Is Ahead for the Nation’s Aging Workforce?April 24, 2018The percentage of employed older people increased during the past two decades and these workers are earning more on average than older workers in the past.
-
EmploymentJobs With the Largest Gender Pay Gaps in Finance, SalesMay 22, 2018The gender pay gap persists in almost all occupations but is much greater in some jobs.
-
Business and EconomyHow Many Work in Manufacturing?October 04, 2018The Annual Survey of Manufactures shows manufacturing receipts and how many are employed in manufacturing by state and by sector.
-
Business and EconomyEntertainment, Travel, and Recreation Industries ReboundingApril 23, 2025A look at which selected travel, entertainment and recreation-related industries hit hard by the pandemic rebounded.
-
Income and PovertyNew Snapshots From the Survey of Income and Program ParticipationApril 21, 2025New Census Bureau product offers mobile-friendly fact sheets on who receives income from various sources.
-
PopulationU.S. Metro Areas Experienced Population Growth Between 2023 and 2024April 17, 2025New Census Bureau population estimates show 88% of U.S. metro areas gained population between 2023 and 2024.
-
Business and EconomyWhat Is the Nonemployer Marine Economy?April 09, 2025Thirty states had nonemployer businesses in marine economy sectors, including six states in the Midwest with receipts totaling nearly $11 billion in 2022.


