
Official websites use .gov
A .gov website belongs to an official government organization in the United States.
Secure .gov websites use HTTPS
A lock (
) or https:// means you’ve safely connected to the .gov website. Share sensitive information only on official, secure websites.

Topics
Data & Maps
Surveys & Programs
Resource Library

Infographic Shows Total Value of Manufacturing Shipments and Payroll
The U.S. Census Bureau has released its most detailed statistics on the U.S. manufacturing sector in more than two years.
The stats come from the newest Annual Survey of Manufactures (ASM), which contains info for survey year 2018. The ASM is not collected in Economic Census years — years ending in ‘2’ and ‘7.’
Also available: an infographic of 2018 ASM data outlining the total value of shipments and total payroll in the United States in the manufacturing sector.
The 2018 ASM Summary Statistics table provides data on:
- Employment
- Payroll
- Cost of materials consumed
- Operating expenses
- Value of shipments
- Value added by manufacturing
- Fuels and electric energy used
- Inventories
Additionally, the ASM provides the most detailed measure of U.S. manufacturing industry outputs and inputs.
The ASM includes manufacturing establishments (or the physical location of the manufacturing plant) with one or more paid employees, or nonemployers that use leased employees. In addition, it displays statistics at the 3-, 4- and 6-digit NAICS (North American Industry Classification System) level.
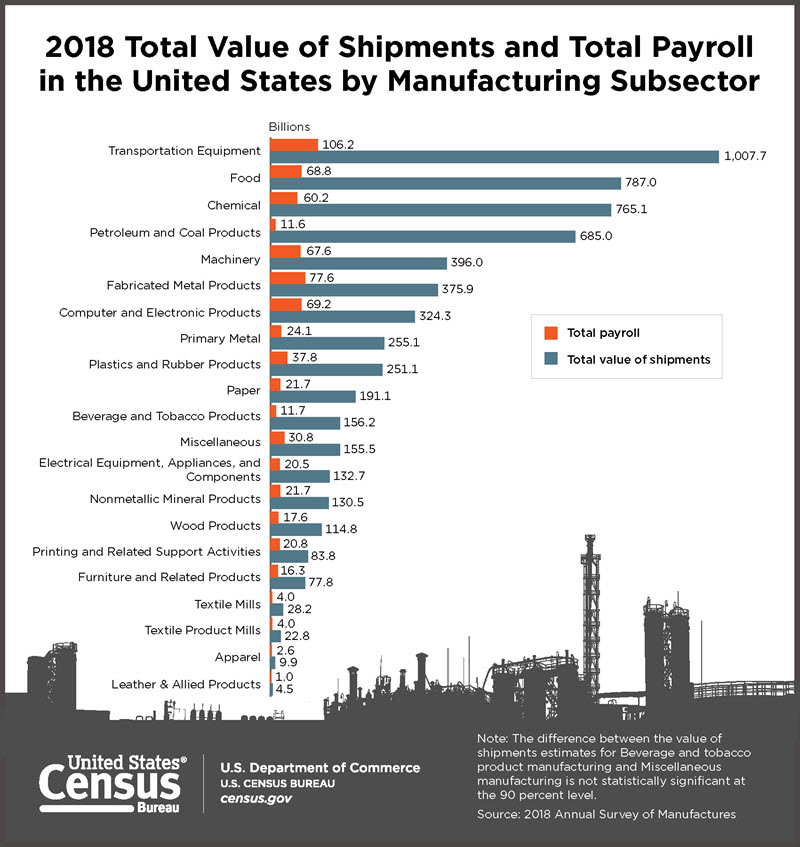
The infographic above shows the leading U.S. manufacturing industries by total value of shipments and payroll.
For example, Transportation Equipment had the greatest total value of shipments in the manufacturing sector with over $1 trillion – the first manufacturing subsector to surpass the $1 trillion mark. This NAICS category also has a total payroll of over $105 billion.
Food manufacturing ($787 billion in total values of shipments) and chemical manufacturing ($765 billion in total value of shipments) followed as the next largest producers in the manufacturing sector.
Key data users of the ASM results include the Bureau of Economic Analysis (BEA), the Bureau of Labor Statistics (BLS), as well as the Federal Reserve Board (FRB).
The BEA uses the published data to produce gross domestic product (GDP) estimates. The BLS uses the info to calculate annual productivity series and update producer price indexes. And the FRB uses ASM data points to prepare the Index of Industrial Production.
Adam Grundy is a supervisory statistician in the Economic Management Division at the Census Bureau.
Stats for Stories
National Manufacturing Day: October 6, 2023
The U.S. Census Bureau joins a group of public and private organizations in celebrating the importance of the manufacturing sector of the nation’s economy.
Stats for Stories
World Trade Month and Week: May and May 21-27, 2023
The 2020 County Business Patterns program counted 8,212 forestry and logging establishments, with 50,710 paid employees and $2.6B in annual payroll.
America Counts Story
New Small Business Pulse Survey Shows COVID-19 Impact on Businesses
The U.S. Census Bureau’s Small Business Pulse Survey yields near real-time economic data on businesses...
America Counts Story
Understanding the Impact of Weather on Business
The U.S. Census Bureau has launched a website for the National Weather Service’s 122 Weather Forecasting Offices that provides data on businesses in each area.
America Counts Story
New Annual Data Show First Trade Deficit Decrease Since 2013
Decline driven largely by a sharp drop in crude oil imports and an increase in exports, according to data released Feb. 5.
Page Last Revised - December 16, 2021
✕
Is this page helpful?
 Yes
Yes
 No
No
 Yes
Yes
 No
No✕
NO THANKS
255 characters maximum
 255 characters maximum reached
✕
Thank you for your feedback.
Comments or suggestions?

Comments or suggestions?