Survey News Volume 8, Issue 2
Survey News Volume 8, Issue 2
In This Issue:
- Unanticipated Challenges, New Opportunities
- A Picture Worth a Thousand Data Points: Monitoring Data Collection with Tableau
- NHIS Refresher Training for Spanish-Speaking Field Representatives
- Coding Operations in the National Survey of College Graduates
- Articles/Blogs from Census Internet
- Other Recent Data Releases
Unanticipated Challenges, New Opportunities
by Eloise Parker, Assistant Director for Demographic Programs
I hope everyone remains safe, well, and working successfully with your new officemates, including the four-legged and under-aged set. The last couple of months have been one for the history books: we watched things unspool almost overnight, only then to experience the true resilience of our staff and operations.
As survey sponsors, your resourcefulness and responsiveness are greatly appreciated as we have adjusted survey life-cycle activities for a virtual world. The Census Bureau’s Regional Office and National Processing Center (NPC) staff have been extraordinary setting up the Field Representatives to conduct interviews by telephone. The staff at NPC expedited advance materials for April’s collections to make sure they got out before the facility closed on March 19. Their quick action ensured that Field Representatives had that communication available as a starting point with respondents. With NPC closed in April, a skeleton staff shipped existing letter inventory to the Regional Offices, where everyone from managers to clerks stuffed and mailed letters for May. If there was ever a time when the data from these surveys will be important, it is now – and the staff has taken that to heart.
Effective May 4, NPC has started to phase staff back in slowly, starting with 100 managers. They are getting used to using Personal Protective Equipment (PPE) and working out ways in which they can bring on staff to resume production activities in a manner that puts their health and well-being first. For the moment, we foresee having enough mail-out materials for June but we are prepared to make adjustments if that changes. We anticipate that June interviewing for our CAPI surveys will continue to take place by telephone. In planning to resume “regular” operations, we are taking our lead from the Census 2020 team so we remain in sync with communications efforts and mindful of preventing public confusion and concern.
This has also been a great time to rise to new challenges. Taking on a call from the federal data user community seeking timely data to understand how American households were experiencing the pandemic from a social and economic standpoint, the Household Pulse Survey was launched into production on April 23. Designed as an online survey with sample sufficient to yield estimates at the state level and for the 15 largest Metropolitan Statistical Areas (MSAs), the Household Pulse Survey will provide data on dimensions of employment, spending, food security, housing and educational disruption. Significantly, the Household Pulse Survey has been a cross-agency collaboration: staff at the Census Bureau, the Bureau of Labor Statistics, the National Center for Education Statistics, the National Center for Health Statistics, the USDA Economic Research Service and the Department of Housing and Urban Development responded quickly to contribute questionnaire content and advise on what data were most important to their user community. The data are being produced under the auspices of the Census Bureau’s Experimental Data Series and the first data will be released the week of May 18. Data will be collected for 90 days, with releases on a weekly basis.
The process of deploying the Household Pulse Survey has enabled everyone working on it to learn and improve in real time. This more agile approach positions the federal statistical system to be responsive to the next national crisis. Additionally, this survey supplements established benchmark data products with other data sources for government officials and policymakers who must make real-time decisions that support recovery. While we do not look forward to replaying the circumstances that prompted the Household Pulse Survey, it has been a pleasure to work with many of you on this effort and know what can be made possible when events demand.
We look forward to returning to normalcy and seeing you soon.
Census Academy Webinar June 10, 2020: Taking the Pulse of American Households during COVID-19
Tune in from 1:00-3:00 to learn more about how the Federal government is collecting, disseminating and using the Household Pulse data to understand how American households are affected by COVID-19 on a socio-economic level.
by National Survey of Children’s Health Survey Team
Background
Data collection monitoring can be a cumbersome process, involving manual efforts to update tables and graphs in Excel and often lagging with real-time data collection. Monitoring data collection involves analyzing data to determine response rates, comparing rates to previous years, and identifying any issues that need further review. For the National Survey of Children’s Health (NSCH), we looked at this process and ways to make it less burdensome, more intuitive and more interactive.
The NSCH is sponsored by the Maternal and Child Health Bureau of the Health Resources and Services Administration, an agency in the U.S. Department of Health and Human Services. The NSCH looks at the physical and emotional health of children ages 0-17, with a special emphasis on factors related to child well-being. Additionally, the NSCH assesses the prevalence and impact of special health care needs among children. Respondent information is collected for an address-based sample on a yearly basis, with both web and paper instrument options.
For the 2020 data collection, our team wanted to create a modern data dashboard for production monitoring in real-time. The dashboard conceived would be intuitive, interactive, visually appealing, generate new insights about production data, and provide cost-saving benefits. After determining that Tableau would be the best platform for this effort, we analyzed aspects of our current production monitoring system that utilizes Excel and could be improved using Tableau. With support from the Census Bureau’s Center for Applied Technology (CAT), we found Tableau to be very straightforward and user-friendly. Tableau allows us to interact with the data in real-time, while allowing filters that isolate specific details. This feature along with additional graph options, such as a state map, creates more in-depth insights about our production data.
Tableau allows data to be available sooner and with less fuss. A team member runs a SAS script that produces a series of tables that are manually copied into an Excel spreadsheet. Key results are shared with other team members and the NSCH sponsor. The dashboard can be linked directly to the production data file, and users with access can trigger an update.
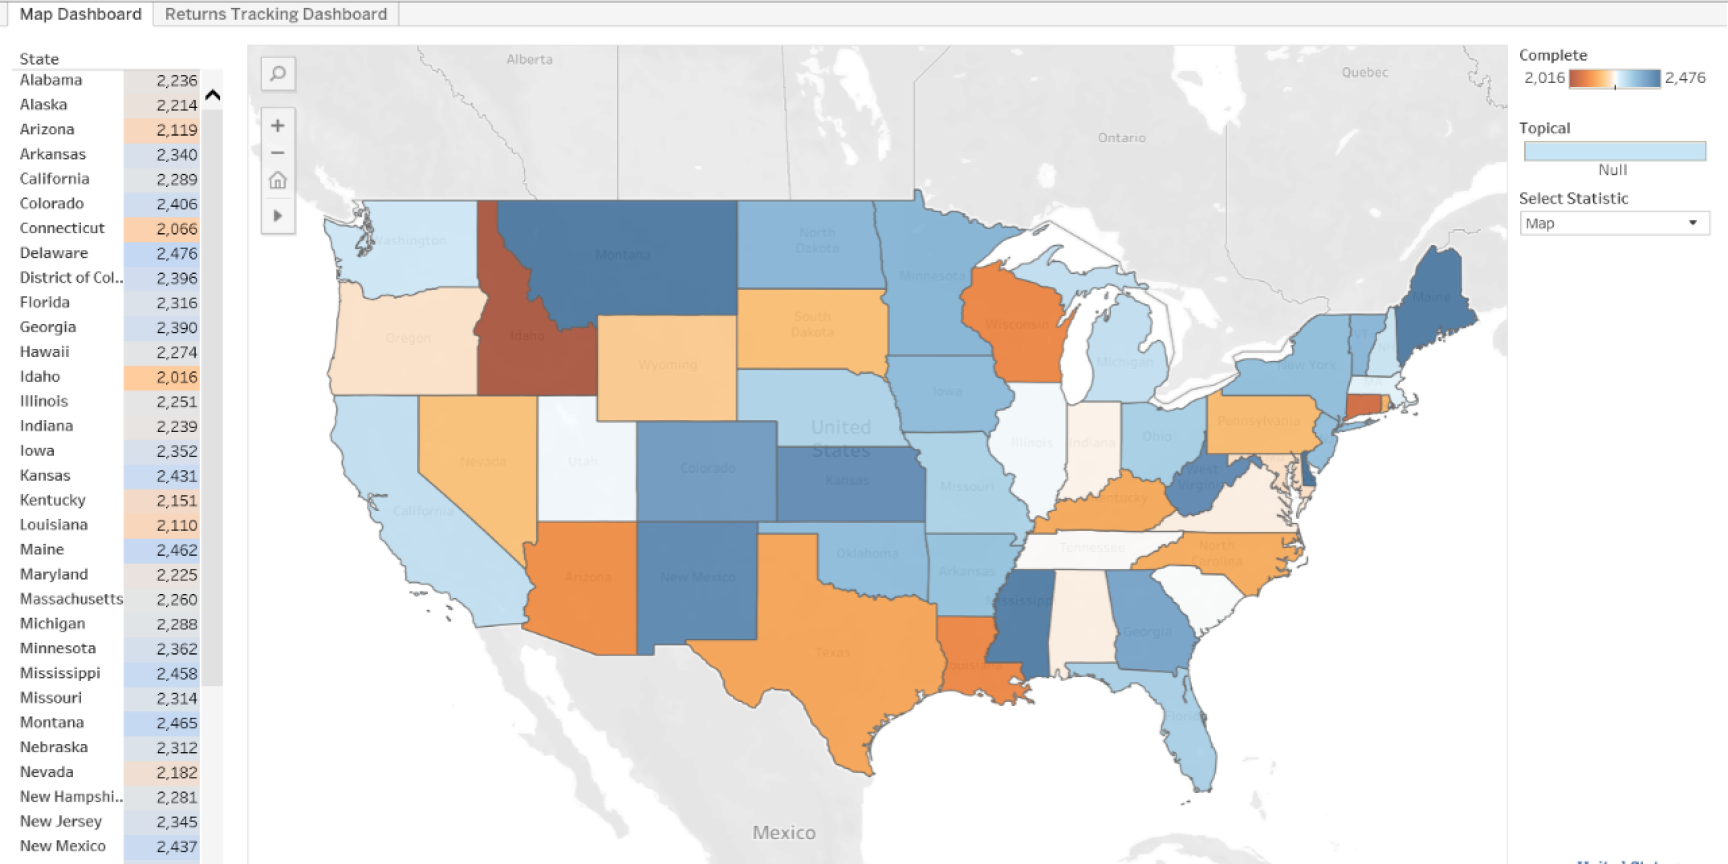
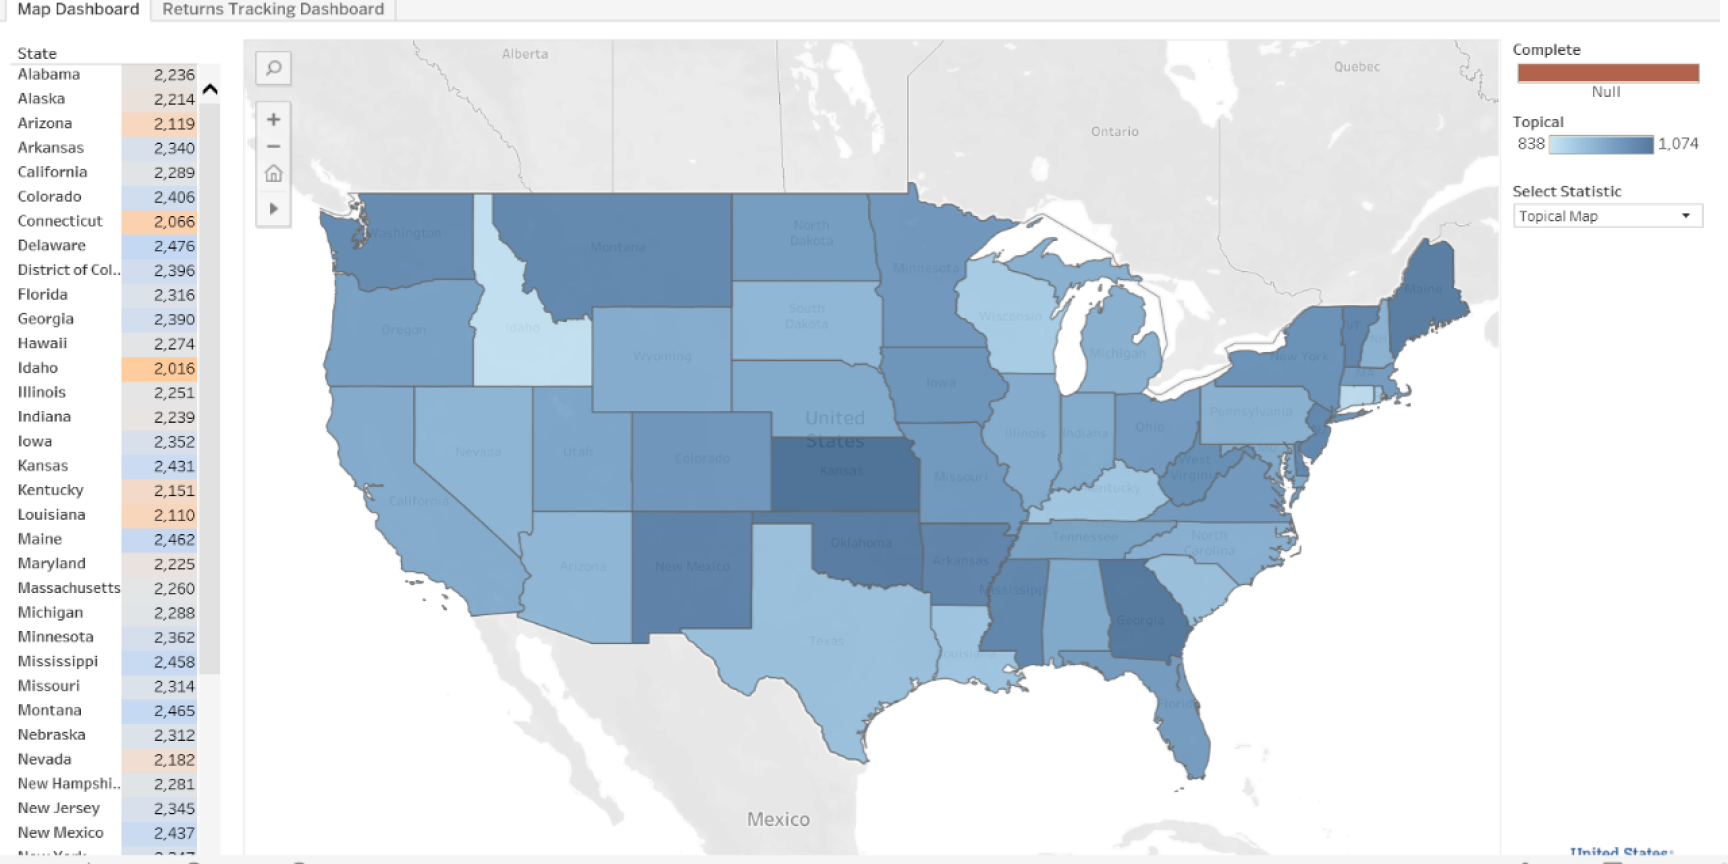
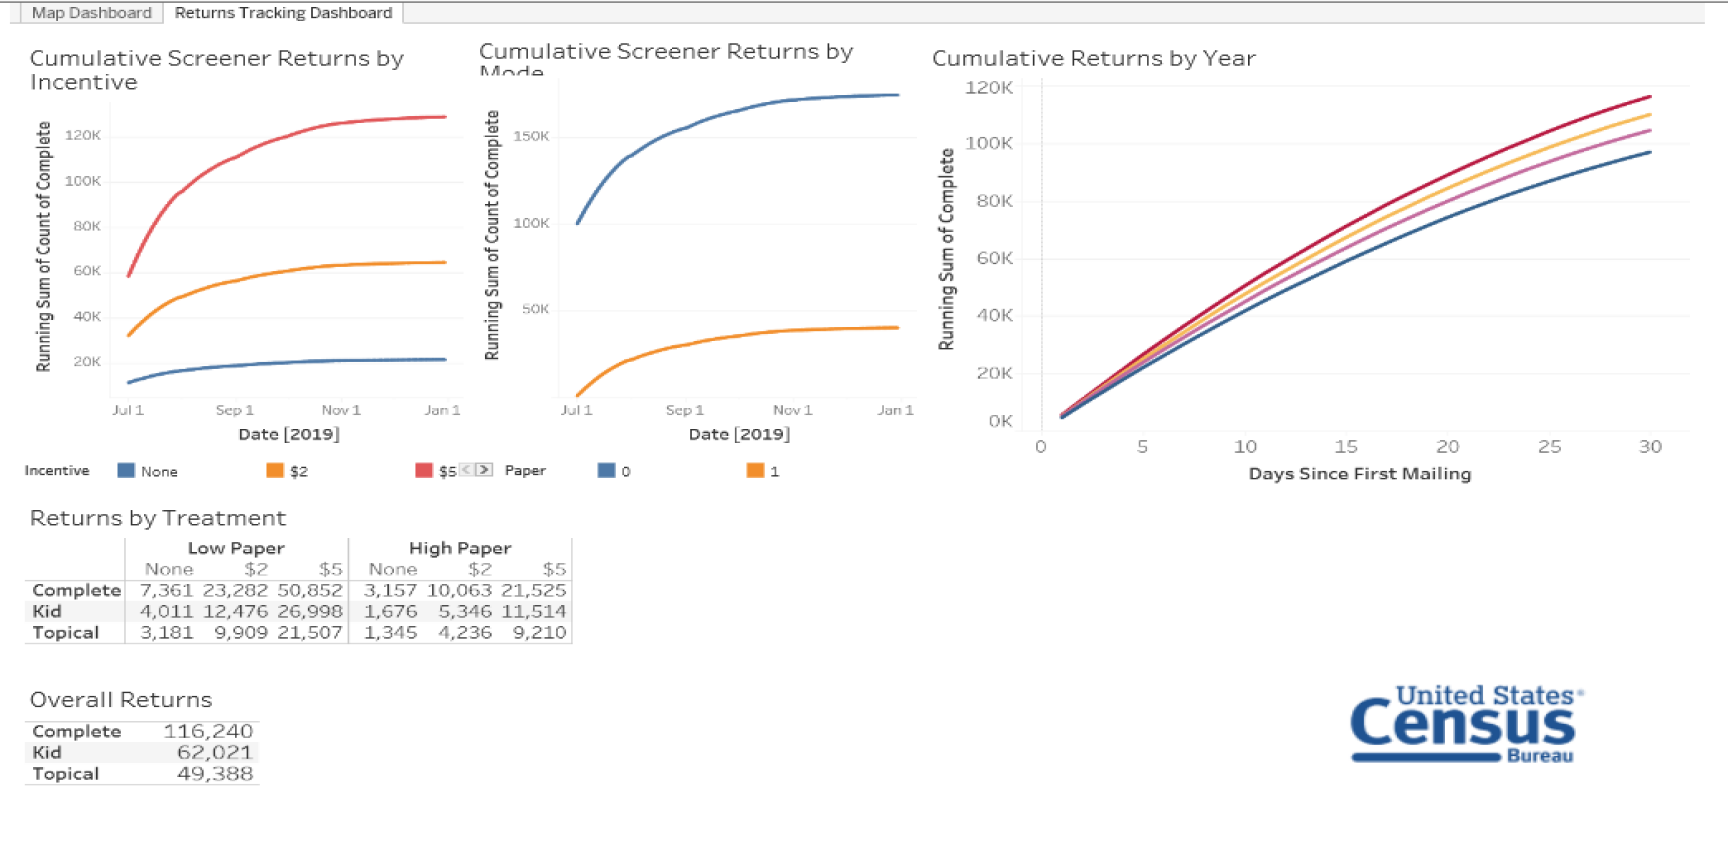
We believe this dashboard could be a valuable tool for other self-response surveys. We will continue to provide updates as our development of the data dashboard materializes into a final product. Our plan is to test it in our 2020 data collection monitoring alongside our previous production monitoring system. We will first duplicate the functionality of the current process, and then transition to exclusively using the Tableau tool. We will then expand and modify the presentation, leveraging Tableau’s unique capabilities. Below are images of our drafted proposal design for the data dashboard, modeled after our Excel production monitoring sheet and used to develop the original concept. The examples below are prototype only and contain only mock data.
Image 1. U.S. map of response rates by state
Image 2. U.S. map of response rates by state by topical form
*Note that this study consists of both screener and topical components
Image 3. Graphs of different components incorporated from our current tracking spreadsheet to capture progression in data collection
by Cynthia Guerrero
The National Health Interview Survey (NHIS) conducted its first refresher training for Spanish-speaking Field Representatives (FRs) in September 2018 to coincide with the redesigned 2019 NHIS Spanish instrument. With the support of its sponsor the National Center for Health Statistics (NCHS), the Census NHIS team had the opportunity to create an in-person training that allowed FRs to discuss tips on how to be successful in obtaining quality data and address challenges when interviewing non-English cases. Interviewers who were designated as Spanish speakers by their respective regional offices (ROs) completed a self-study prior to training. Approximately 100 FRs identified by their ROs as Spanish speakers took the self-study and attended one of the two trainings sessions held for bilingual FRs. Training sessions were two hours long and conducted by bilingual trainers from Census and NCHS. The training covered the following:
- Availability of materials translated into Spanish
- Development of the translation process
- Best practices for interviewing respondents including guidelines for using interpreters for other languages
- How to address common respondent concerns in Spanish
- Spanish pronunciation of difficult medical terms
- Role playing difficult door-step scenarios in Spanish among FRs, followed by group discussions
- Census and NCHS trainers addressed FR questions
The FRs enjoyed the face-to-face training overall, especially the Spanish pronunciation activity. In this activity, two songs were selected, the lyrics were changed to include medical terms, and the songs were sung live with a vocalist (from Census) accompanied by a ukulele player (from NCHS) to help FRs remember how to pronounce difficult medical terms. These songs were also recorded so FRs could access them after the training for additional practice.
In contrast to 2018’s in-person training, in 2019 the NHIS Spanish-speaking interviewers completed their refresher training online through the Commerce Learning Center (CLC). In this training, two interactive modules were created. The first module categorized a list of medical terms and each term had a recorded voice to help interviewers pronounce each term. The second module was a selection of new questions added to the 2020 NHIS instrument with a recorded voice reading each question. An FR memo was provided via email that included instructions on how to access the CLC modules, an interview scenario summary that detailed how to answer certain sets of questions, and a list of the medical terms with the phonetic spelling. Approximately 96 percent of the Spanish-speaking FRs who took the online Spanish refresher training in 2019 rated it as very good or good in helping them prepare for their 2020 NHIS interviews.
The NHIS team has had the opportunity to train NHIS Spanish-speaking interviewers in-person and online. Each method of training has had its challenges and benefits, but providing a training for bilingual FRs is invaluable to their success with Spanish-speaking respondents.
by Brian Lester, Survey Statistician, and Tim Gilbert, Assistant Survey Director, National Survey of College Graduates Team
The National Survey of College Graduates (NSCG) conducts five separate coding operations to convert verbatim survey responses to standardized code lists. The coding process involves collaborative work with staff at Census headquarters and the National Processing Center (NPC). The NSCG coding operations include reviewing field of study, occupation, educational institution, certification, and other-specify responses.
Field of study coding consists of comparing the verbatim provided by the respondent to the self-code selected from a list of major fields of study across academic departments. Similarly, for occupation coding, respondents choose a code from a list of job categories to determine the category that best matches their occupation.
Educational institution coding is the process of classifying the post-secondary educational institution from which the respondent obtained his/her degree to assign a code from the Integrated Postsecondary Education Data System (IPEDS): a single, comprehensive system designed to include all educational institutions and organizations whose primary purpose is to provide postsecondary education.
Certification coding consists of identifying the subject or field of study of any current certificates and licenses that respondents hold. For example, this might be a registered nurse license, a teaching certificate, or an IT certification.
Other-specify coding involves questionnaire items that include answer categories, with an option for a write-in response called “other-specify.” This operation determines if the sample persons’ verbatim entries belong in the existing response categories and make the appropriate corrections.
With a total sample of size of 147,000, manually coding each necessary item in every case would be daunting. To reduce this burden, the NSCG’s IT team has developed an autocoding process where respondents’ answers are compared to lists of answers associated with particular codes and automatically assigned the correct code. All remaining responses that cannot be autocoded are coded manually by staff at NPC. Manual coding allows coders to compare other data provided by the respondent to the data from the item being coded to see if a more accurate code would be appropriate. However, many of the cases result in confirming the “self-code” selected by the respondent.
The coding process for the 2019 NSCG began midway through data collection when headquarters staff conducted training with twelve coders at NPC. Upon completion of training, coders were required to qualify by correctly coding practice cases. Production cases were compiled into batches of 100 within each individual operation. A sample of 15 cases from each batch of 100 coded cases was then sent to quality control coders, also at NPC, who independently assigned code to the cases. Results were compared to the original code assigned, and differences were adjudicated as necessary. This process helped ensure that coding data was as accurate as possible. Headquarters staff spent time at NPC during production to work hand-in-hand with coders to provide on-the-job instruction.
The NSCG coding process allows survey operations staff at headquarters to work directly with NPC coding staff during training, production, and quality control work in order to maintain quality of the data and timeliness for further processing and dissemination.
Articles/Blogs from Census Internet
NEW COVID-19 Data Hub V 1.0
This site provides users demographic risk factor variables along with economic data on 20 key industries impacted by Coronavirus. Each data set can be displayed in different visualizations, maps, can be shared, available for download, and are periodically updated.
2020 Census Operational Adjustments Due to COVID-19
We’re adapting or delaying some of our operations to protect the health and safety of our staff and the public and make sure we get the same population counted another way. The Census Bureau released a timeline of 2020 Census activities and operations adjusted due to COV-19.
New Household Pulse Survey Shows Concern Over Food Security and Loss of Income
The first results from the new U.S. Census Bureau Household Pulse Survey released May 20 show that many households have experienced loss in employment income, are concerned about food security, and have deferred decisions to access health care. Adults who responded reported feeling anxious or nervous more than half the days last week or nearly every day 29.7% of the time.


