
Official websites use .gov
A .gov website belongs to an official government organization in the United States.
Secure .gov websites use HTTPS
A lock (
) or https:// means you’ve safely connected to the .gov website. Share sensitive information only on official, secure websites.

Topics
Data & Maps
Surveys & Programs
Resource Library
Survey News Volume 7, Issue 4
Survey News Volume 7, Issue 4
In This Issue:
- FY2020 Greetings
- NHIS Advance Letter Test
- Model-based Enhancements for the National Survey of Fishing, Hunting and Wildlife-Associated Recreation
- Current Coverage, Calendar-Year Coverage: Two Measures, Two Concepts
- Census Bureau Teams Up With Tech Giants to Connect With Millennials and Other Hard-to-Count Populations
- U.S Census Bureau Celebrates Role in U.S. Constitution
- Current Population Survey Design and Methodology Technical Paper 77
- A Farewell to TPOPS
- U.S. Census Bureau Releases 2017 Economic Census First Look Estimates
- Other Recent Data Releases
FY2020 Greetings
by Eloise Parker, Assistant Director for Demographic Programs
There is no year like a “zero” year at the Census Bureau, and the 2020 Census activities are already in full swing. As of September 16—26,500 address canvassers were deployed to verify addresses. The new Census Logistics Center, located a few miles down the road from the National Processing Center in Jeffersonville, IN, is now open and humming with the onboarding and training of staff -- and the preparation of hundreds of thousands of enumerator bags. State-of-the-art printing and assembly machines are in place, and materials are stored on pallets four stories high. To give you a taste of the action, we have included a few more articles than usual in this issue related to the 2020 Census.
For all the energy around the 2020 Census, however, the Census Bureau’s Demographic Programs Directorate remains focused on the successful management our household survey programs. Where we see investments in the decennial census benefitting us, we are taking them; where we see risks of census activities causing resource strains or confusion for members of the public engaging with Field Representatives, we are working aggressively to manage them. We are fortunate to have John Baker and his exceptional managers in Field HQ who keep the regional offices focused on our surveys, and we continue to enjoy the resourcefulness of Daniel Eklund and his team as they negotiate our operational needs with staff at the Jeffersonville, IN National Processing Center.
A couple pieces of additional news:
- The next Census Bureau Household Sponsors Meeting will take place on Thursday, October 24, 9:30AM – 3:30PM, in the Census Bureau Auditorium. We will use this opportunity to provide you with an update on the 2020 Census activities – including operations and the 2020 Census communications plan. Members of the Census Open Innovation Lab (COIL) will present on taking a human-centered design approach to the development of data products, and we will provide a brief update on the status of differential privacy research at the Census Bureau. Additionally, staff from sponsoring agencies will share initiatives designed to address survey cost and efficiencies, as well as demands for new sources of data. It’s a full agenda and we look forward to seeing you there.
- We have a new Survey Director joining our senior management team in ADDP-SO: Lindsay Howden has accepted the position of Census Bureau Survey Director for the National Center for Health Statistics’ National Health Interview Survey, replacing Anne Furnia who retired in September. Lindsay has worked at the Census Bureau since 2009, where she started in the Age and Special Populations Branch within the Population Division working on the processing and review of data for the 2010 Decennial Census, and serving as a subject matter expert in the area of age and sex data. Lindsay then worked as a team lead on the National Health Interview Survey Team before becoming an Assistant Survey Director for the National Ambulatory Medical Care Surveys team. She has a B.A. in Sociology from Texas A&M University – Corpus Christi, and an M.S. and Ph.D. in Sociology from Texas A&M University. She also has a master’s certificate in project management from George Washington University.
Please enjoy the rest of the newsletter – and see you on October 24!
NHIS Advance Letter Test
by Kelly Holder, Survey Statistician, and Ann Daniele, Survey Statistician, National Health Interview Survey Team
In May 2019, the National Health Interview Survey completed a 3-month experiment of the advance letter mailed to respondents. The test letter was designed in a partnership between the survey sponsor, the National Center for Health Statistics (NCHS), and MITRE. It used simplified and concisely worded text and a redesigned layout that added graphics, banners, and color. All this made the letter easier to read and understand and helped address the respondent’s concerns more quickly. The design was intended to “nudge” respondents to change their decision making process, in order to promote survey participation.
Other key features of the test letter include:
- Customized salutation – The letter provides a personalized salutation by inserting the county name where the respondent resides (“Dear [County Name] Resident”) in the letter and on the envelope slipsheet.
- Appointment option – The letter lets the respondent know what to do next by providing the Regional Office phone number and instructions so they can schedule an appointment for their interview.
- Identifies benefits of the survey– The letter provides reasons why the respondent should participate in the survey.
- Emphasizes the irreplaceability of the family –The letter lets the respondent know why they are important and cannot be replaced.
- Confidentiality ensured – The letter provides a description of data confidentiality and how records identifying each participant will be maintained.
The monthly samples were split so half the addresses received the existing advance letter (control) and half received the modified letter (test). While the design of the modified letter makes it easier at a glance for respondents to find the information they need quickly, the modified letter ultimately did not result in a statistically significant increase in response rates or appointment scheduling. However, because of the improved look and feel, NCHS decided to move forward using the test letter and continues plans to experiment with other materials in the future.
Model-based Enhancements for the National Survey of Fishing, Hunting and Wildlife-Associated Recreation
by Wesley Basel, Survey Statistician, James Scurry, Survey Statistician, Jiwon Lee, Mathematical Statistician, and Jasen Taciak, Supervisory Survey Statistician, Social, Economic, and Housing Statistics Division
The 2016 Survey of Fishing, Hunting, and Wildlife-Associated Recreation (FHWAR) used an innovative design structure to maximize the quality of national-level estimates within the client’s budgetary limitations. But given the common trends of decreasing survey response and increasing cost per response, the Census Bureau was unable to design a survey to produce state-level estimates within the constraints. To address this concern for the current and future surveys, the Social, Economic, and Housing Statistics Division’s, Small Area Estimation (SAE) team is collaborating with the survey team to produce prototype state-level estimates, using a model-based approach to combine auxiliary data sources with the direct responses.
The objective of this project is to determine the feasibility of producing state-level estimates of three activity indicators for state-resident participants for each of three main activities. The indicators are: number of participants, total days afield, and total annual expenditures. The three activities as listed in the title of the survey are hunting, fishing and wildlife-associated recreation.
In general, model-based SAEs can be a cost-effective method to improve the precision of targeted concepts beyond what the survey responses alone can support. These SAE methods provide a formal way to combine the direct estimates from the survey of interest with auxiliary data sources, such as administrative records, larger-scale surveys, and demographic estimates.
In the case of the FHWAR SAE project, the team is pursuing an area-level (i.e. state aggregate) approach utilizing four primary sources of auxiliary data: hunting license issuance to residents, proximity to geographic features (such as wildlife areas, or coastline), population estimates by demographic category, and income group tallies from the American Community Survey. Other datasets are also under evaluation, such as establishment or employment counts for FHWAR-related activities, such as big-box hunting or fishing retail establishments. Also, the prevalence of rural population within a state may prove useful.
For administrative records, the survey team had previously acquired hunting license data tabulated by county of residence from each state, which was used in forming primary sampling units, and determining sample rates. This data source is obviously strongly correlated with hunting activity, but given differences in hunting license requirements, systematic bias corrections must be applied. For example, many states do not require landowners to obtain licenses to hunt on their own property. Furthermore, many American Indians are exempt from license requirements. To improve the usefulness of this data, additional concepts are included, which is a common need in utilized administrative records.
Demographic estimates from the Population Division’s Population Estimates Program allow detailed correlation of age and sex categories to wildlife activities. And finally, the American Community Survey provides other indicators, such as income groupings and education. The inclusion of data from a large-scale survey to improve the estimates of a specialized, smaller-scale survey is an ongoing research trend within the Census Bureau’s SAE teams. Innovation in such techniques can lead to increased leverage of existing Census Bureau resources and products in an increasingly challenging survey environment.
Results from this prototype SAE project for the FHWAR survey are expected by the end of the year, and will be published shortly afterwards.
Current Coverage, Calendar-Year Coverage: Two Measures, Two Concepts
by Sharon Stern, Assistant Division Chief, Employment Characteristics, Social, Economic, and Housing Statistics Division
Analysis of the new current health insurance coverage estimates in the Current Population Survey Annual Social and Economic Supplement.
On September 10, 2019, the U.S. Census Bureau released findings on health insurance coverage from the Current Population Survey Annual Social and Economic Supplement (CPS ASEC). For the first time, health insurance estimates will reflect important changes to the CPS ASEC. The CPS ASEC Redesign and Processing Changes blog and series of working papers describe the changes made and how estimates may look different from previous releases. This article focuses on one of the new measures — current health insurance coverage — and how it differs from the primary measure of coverage in the previous calendar year released in the CPS ASEC.
These new estimates of current coverage offer a snapshot of health insurance coverage in early 2019, when the CPS ASEC data were collected. It is important to note that these estimates cannot be used to predict whether coverage in 2019 will necessarily be higher or lower than 2018. As demographic, economic and policy changes may unfold over the next several months, we need to wait until the September 2020 CPS ASEC release to know what the full-year, uninsured rate will be for 2019. This article describes how the new estimates are created and how to interpret them.
In 2014, the Census Bureau introduced a redesigned health insurance questionnaire in the CPS ASEC, based on over a decade of research, in order to capture timely and relevant information on the nation’s health insurance coverage during the previous calendar year, while also minimizing respondent burden. In addition to other changes, this redesigned questionnaire added a question about the type of coverage held at the time of interview. The primary purpose of adding this current-coverage question was to improve respondent recall regarding health insurance coverage in the previous calendar year. Recall bias was a documented issue with research from cognitive testing and large-scale surveys showing that the 14- to 16-month reference period was a challenge for respondents.
The health insurance section of the questionnaire begins with questions about current coverage. The computer-based data collection questionnaire is highly dynamic, tailoring follow-up questions based on previous answers. This adaptive design results in a variety of ways in which a person can report coverage. Despite that, in all cases, the first questions about health insurance ask about coverage at the time of interview for the most common sources of coverage that a person might have. Specifically, the starting questions are as follows:
- [For certain respondents, including respondents age 65 and older]: Medicare is health insurance for people 65 years and older and people under 65 with disabilities. Are you NOW covered by Medicare?
- Do you NOW have any type of health plan or health coverage?
- Are you covered by Medicaid, Medical Assistance, or (CHIP/or Medicare)?
- Are you NOW covered by a state or government assistance program that helps pay for healthcare, such as: State Medicaid, CHIP, Exchange/Portal, or other State Health program?
- Are you NOW covered by Veteran's Administration (VA) care?
If the person says “no” to all of the above, they get the following question:
- You are not currently covered by a health plan. Is that correct?
If a person said “yes” to one (or more) of the above questions, they get a set of questions about the source of the coverage they have now. For instance, if they have private coverage, they get a follow-up question asking whether they got the coverage through a family member or whether it was purchased directly. This is followed by a question about whether the respondent held this coverage all of the previous year:
- Did your coverage from (plan type) start before January 1, 2018?
If the answer is “no,” the questionnaire asks when coverage began and initiates a series of questions that captures information to “fill in the blanks” and provide information about the coverage they had during the calendar year. In other words, the respondent will answer questions about other coverage they had during the previous calendar year. While the full set of interview paths is more complicated than this implies, this set of questions allows the Census Bureau to produce two types of health insurance estimates from the same survey.
Health insurance coverage during the previous calendar year (annual coverage).
The main measure of health insurance coverage in the CPS ASEC examines estimates from the previous calendar year. In the CPS ASEC, people are considered to have coverage if they were covered by health insurance for part or all of the previous calendar year. People were considered uninsured if, for the entire year, they were not covered by any type of health insurance. That is, in the 2019 CPS ASEC, people are considered uninsured if they did not have coverage at any point during 2018.
Health insurance coverage at the time of the interview (current coverage).
The new processing system introduced this year gives us the ability to present a current-coverage measure for the CPS ASEC. Answers to the “now” coverage questions are used to create estimates that represent health insurance coverage held, as well as the uninsured rate, at the time of interview. The CPS ASEC interviews occur mainly in March with additional interviews in February and April, and estimates are weighted to the population as of March.
The current-coverage measure and the calendar-year measure described earlier give different and complementary information about peoples’ experience with health insurance coverage. Coverages can change during a year, and people can (and do occasionally) experience short periods during which they have no insurance.
In general, the percentage of the population who are uninsured at a specific point in time will be higher than the percentage of people who had no health insurance during that entire calendar year. Data from the 2017 CPS ASEC Research File and the 2018 CPS ASEC Bridge File offer support for that expectation.
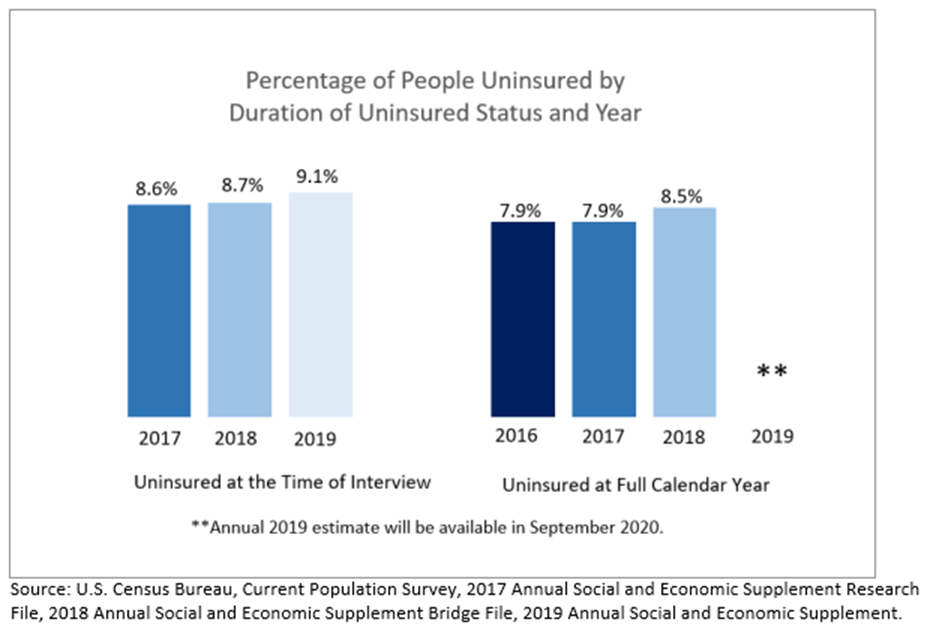
Figure 1 shows the two uninsured rates available in the CPS ASEC — the calendar-year measure and the current-coverage measure — across three years. In 2016, 7.9% of people did not have health insurance in any month. Using the same source (2017 CPS ASEC Research File), the current-coverage measure centered around March of 2017 results in an uninsured rate of 8.6%. These rates are statistically different but do not imply anything specific about what the 2017 calendar-year uninsured rate will be. In fact, the 2017 uninsured rate was 7.9% (not statistically different from 2016), using the consistently edited 2018 CPS ASEC Bridge File.
Using the 2018 CPS ASEC Bridge File, we find a similar result. The uninsured rate for calendar year 2017 was statistically different from the uninsured rate at the time of interview (February to April 2018) at 8.7%. As expected, the percentage uninsured at the time of interview is higher than the percentage uninsured for the entire previous calendar year.
Finally, comparing the measures between years shows consistent results. The uninsured rates from the 2018 CPS ASEC Bridge File and the 2017 CPS ASEC Research File had similar results. Specifically, the uninsured rate for the previous calendar year did not statistically change between 2016 and 2017; and the uninsured rate for the time of interview did not statistically change from 2017 to 2018.
The Census Bureau released these new estimates to provide additional information that could be useful in understanding the overall health insurance coverage climate. As reported in Health Insurance Coverage for the United States: 2018, the American Community Survey (ACS) also provides information on current coverage. The ACS current-coverage measure and the CPS ASEC current-coverage measure have different reference periods. Where the CPS ASEC is collected during three months and centered around March, the ACS collects data throughout the year and the resulting measure of health coverage reflects an annual average of current health insurance coverage status.
Census Bureau Teams Up With Tech Giants to Connect With Millennials and Other Hard-to-Count Populations
by Zack Schwartz, Program Manager, Center for New Media and Promotion
“Alexa, when does the 2020 Census begin?”
“Hey Siri, do I need to complete the 2020 Census?”
Welcome to the 2020 Census, the first to offer everyone the opportunity to respond online.
Millions are using voice-based commands to request and receive information on a daily basis. That’s a great opportunity for the Census Bureau to reach audiences and households throughout the United States.

New uses of technology are transforming the way the U.S. Census Bureau will attempt to count every person in the United States once, only once, and in the right place.
It’s a long way from the last decennial census in 2010, when all the questionnaires were on paper and an iPhone 4, early Samsung or HTC cellphone were considered state of the art. Now there is a broad array of social media platforms and chatbot technology, plus millions more homes now have consistent access to the internet.
The Census Bureau is leveraging cutting-edge solutions and practices that will expand outreach and awareness campaigns.
Using tech innovations helps the Census Bureau reach and connect with traditionally hard-to-count populations, which include tech-savvy young and mobile millennials.
Chatbot Technology and Digital Assistants
Millions are using voice-based commands to request and receive information on a daily basis. That’s a great opportunity for the Census Bureau to reach audiences and households throughout the United States.
To take advantage of this technology, the Census Bureau is collaborating with digital “smart” assistant market leaders to provide awareness information via these digital assistants.
So what will that be like? Try this:
“Alexa, are my census responses confidential?”
Alexa: “Any and all information that you provide in answer to a Census Bureau survey is strictly confidential.”
“Hey Siri, is my data for the 2020 Census secure?”
Siri: “The Census Bureau has strong protection for the information it collects from individuals and businesses under Title 13.”
The Census Bureau will provide the answers that come from these leading “smart” products — helping people get the information based on how we get and consume information today.
Voice assistants will be used only for one-way communication with respondents.![]()
Social Media
By harnessing the capabilities of social media platforms such as Facebook, Twitter, YouTube and Instagram, the Census Bureau is able to connect and share its message with households across the country and hard-to-reach populations that are likely to be active on social media.
By using social media aggregation capabilities, the Census Bureau can address questions and comments about the census and provide direct answers and responses to help them complete the 2020 Census questionnaire accurately.
In addition, this technology enables the Census Bureau to identify and respond to misinformation swiftly before it spreads.![]()
Cyberattack Defense
The Census Bureau is partnering with Microsoft to leverage leading practices from their Defending Democracy Program.
Microsoft has been working to protect campaigns from hacking through enhanced monitoring and increased cybersecurity measures, as well as partnering with federal, state and local officials to quickly identify and disarm cyberthreats.
Cybersecurity is one of the top priorities of the Census Bureau, which has designed, developed and tested its systems to contain cybersecurity threats. Its program meets the latest, highest standards for protecting respondent information.
From the moment data is collected, the goal – and the Census Bureau’s legal obligation – is to keep them safe. Once respondent information reaches Census Bureau systems, it is encrypted and protected. Respondents are also encouraged to protect themselves and their information online.
Census Bureau teams are trained and ready to respond to cyberthreats immediately.
Optimizing Search Engine Results
Partnering with search engines helps ensure that users who search for 2020 Census information get that information quickly and accurately.
For example, if someone searches the start date of the 2020 Census, links with the correct answers would be highlighted at the top of the search engine or advertised on the screen, while fake websites and misinformation are pushed to the bottom of the search list.
Deterring Spam
In 2020, people will be able to fill out the 2020 Census questionnaire at home or on the go. The digital census is supported in 13 languages and can be accessed from almost any computer or mobile device with an internet connection in the United States.
To protect the integrity of the online census, the Census Bureau is using Google’s reCAPTCHA service to protect access to the online questionnaire from spam, bots and other cyberattack attempts.
Why Census Bureau and Tech Are Compatible
Partnerships with big tech companies are enabling the Census Bureau to take advantage of innovative technologies that facilitate awareness, response and security in today’s mobile, digital world.
These collaborations are providing not only a better customer experience but are also giving the U.S. population the tools and knowledge they need to complete the 2020 Census successfully.
These efforts, combined with initiatives that make new uses of technology for self-response, capture address data, enhance dynamic analytics capabilities, and empower the Census Bureau to anticipate tech disruptions, embrace innovation, and own its digital future.
U.S Census Bureau Celebrates Role in U.S. Constitution
by Virginia Hyer, Public Affairs Specialist, Media Relations Branch, Public Information Office
Article I, Section II of the U.S. Constitution mandates a population count of the U.S. every 10 years. Recently, the U.S. Census Bureau celebrated its role in the Constitution at events in Philadelphia next to Independence Hall to educate the public about the importance of the upcoming 2020 Census.
“The Census Bureau is well on its way to conducting its constitutional requirement of a complete and accurate 2020 Census,” Dr. Steven Dillingham, Census Bureau director, said during a press conference at the Independence Visitor Center. “The Constitution is unique because it puts the power of government in the hands of the people — and the census is a big part of that. The census is one of the few national activities the American public does together — it’s the largest peacetime mobilization in our country, and it’s a cornerstone of our democracy.”
To mark Constitution Day, the Census Bureau held a news conference at the Independence Visitor Center and hosted an interactive historical exhibit at the National Constitution Center called “Shape Your Future: A Census Experience.” Thousands of middle school and high school students visited the exhibit, which included information about the 2020 Census, an artifact from each of the 23 previous decennial censuses and interactive activities that allowed students to envision what their lives may be like during future censuses.
During the news conference, the Census Bureau announced that the 2020 Address Canvassing operation is ahead of schedule and below budget. As of Sept. 16, more than 26,500 address listers have been deployed to verify addresses for the Census Bureau’s mailing list. These listers have walked 821,152 blocks to date, which is over 40,300 more blocks than the projected schedule. In addition, the cost of the Address Canvassing operation is under budget at this point in the operation (Planned cost: $85.7 million. Actual cost: $59.0 million).
“We are pleased to see that the Address Canvassing operation is on track. This is thanks to a decade of planning and implementation of efficient technology,” said Director Dillingham. “Our address list lays the foundation for an accurate census, so that six months from now, households across the nation can receive their invitation to respond to the 2020 Census online, by phone, or by mail, and so we can follow-up with nonresponding households.”
Address canvassing builds and refines the Census Bureau’s address list of households nationwide, which is necessary to ensure a complete and accurate count of everyone living in the United States. Communities across the nation will continue to see address listers canvassing their neighborhood through mid-October.
In six months, households will receive an invitation to participate in the 2020 Census from either a postal worker or a census worker. Every household will have the option of responding online, by phone or by mail. Depending on how likely an area is to respond online, households will receive either an invitation encouraging response online or an invitation accompanied by a paper questionnaire. Households that do not respond will receive reminders — and eventually receive a paper questionnaire.
During the Constitution Day event, officials praised the efforts of Census Bureau partners and complete count committees across the nation to raise awareness of the importance of a complete and accurate count in the 2020 Census. At this time, there are over 400 national participating organizations and almost 60,000 local partners raising awareness about the 2020 Census.
“Local complete count committees across the country are hosting promotional events, displaying census information in government buildings, and are even including census messages on customer billing statements or other correspondence,” said Fernando Armstrong, Philadelphia regional director. “Complete count committees, like Philly Counts 2020, are our trusted voices in the community to let people know that responding to the census is easy, safe and important.”
Census Bureau officials highlighted the work of the Philadelphia complete count committee. Philadelphia’s complete count committee, Philly Counts 2020, has worked with the Census Bureau’s Philadelphia regional office to reach hard to count communities. For example, Philly Counts 2020 has set up training sessions across Philadelphia to help people know how to talk to their friends and neighbors about why the census is important. These “census champions” will be the voices in their community.
“We are happy to be working closely with the U.S. Census Bureau to ensure a complete and accurate count in Philadelphia. Constitution Day is an important time for us to remember that the census is critical to our democracy,” said Stephanie Reid, Executive Director, Philly Counts 2020. “In Philadelphia, we are committed to working with community-based organizations, grasstops, and grassroots leaders through the city to ensure a complete and accurate count."
The 2020 Census officially starts counting people in January 2020 in remote Toksook Bay, Alaska; while most households in the nation will receive invitations to respond (online, by phone or by mail) in March 2020. The Census Bureau will begin advertising in early 2020 to increase awareness of the 2020 Census.
The U.S. Constitution mandates that a census of the population be conducted once every 10 years. Census data are used to reapportion Congressional representation among the states, and to determine how billions in federal funds are distributed to states and local communities every year for services and infrastructure, including health care, jobs, schools, roads and businesses.
For more information on the 2020 Census, visit the Census Bureau website.
Current Population Survey Design and Methodology Technical Paper 77
by Leslie Flores, Mathematical Statistician, Demographic Statistical Methods Division, and Tim Marshall, Assistant Survey Director, Current Population Survey Team
The Current Population Survey (CPS) is sponsored jointly by the U.S. Census Bureau and the U.S. Bureau of Labor Statistics (BLS). It is the primary source of labor force statistics for the United States population, and the source for numerous high-profile economic statistics, such as the national unemployment rate. An updated definitive source for the CPS design and methodology will soon be available with the upcoming release of Current Population Survey Design and Methodology, Technical Paper 77 (CPS TP77). The CPS TP77 will provide the following information for data users and stakeholders of CPS data:
- General CPS Information such as background and history, the questionnaire, and data products.
- Sample Design and Estimation including the frame, weighting, variance estimation, and seasonal adjustment.
- Survey Operations including instrument design, interviewing and transmitting data, data preparation, and organization of field and call center staff.
- Data Quality such as nonsampling error and the reinterview program.
This version of the Technical Paper (CPS TP77) represents a comprehensive update to the previous version published in October 2006 (CPS TP66). Previous content was brought up to date and reorganized to reflect the 2010 Current Survey Sample Redesign, Census Bureau organizational changes, and revised Section 508 standards of the Rehabilitation Act of 1973 for electronic document accessibility.
The effort of reorganizing, revising, rewriting, reviewing, and editing the various parts of the Tech Paper involved a team of more than 40 people collaborating across the Census Bureau and BLS. The technical paper was reorganized into four units based on content (general CPS information, design, operations, and quality), with several chapters and appendices merged and consolidated. TP66 was reviewed for items that were out-of-date and revised accordingly, with some content rewritten to capture current CPS methods. The section on seasonal adjustment and the appendix describing the reinterview program were both expanded into new chapters – Seasonal Adjustment and Reinterview Design and Methodology, respectively. Three chapters dealing with data quality and nonsampling error have been combined into one chapter, Nonsampling Error.
TP77 is pending final agency signatures, and will be available on the Census Bureau’s CPS website shortly.
A Farewell to TPOPS
by Richard Schwartz, Assistant Survey Director, Consumer Expenditure Surveys Team
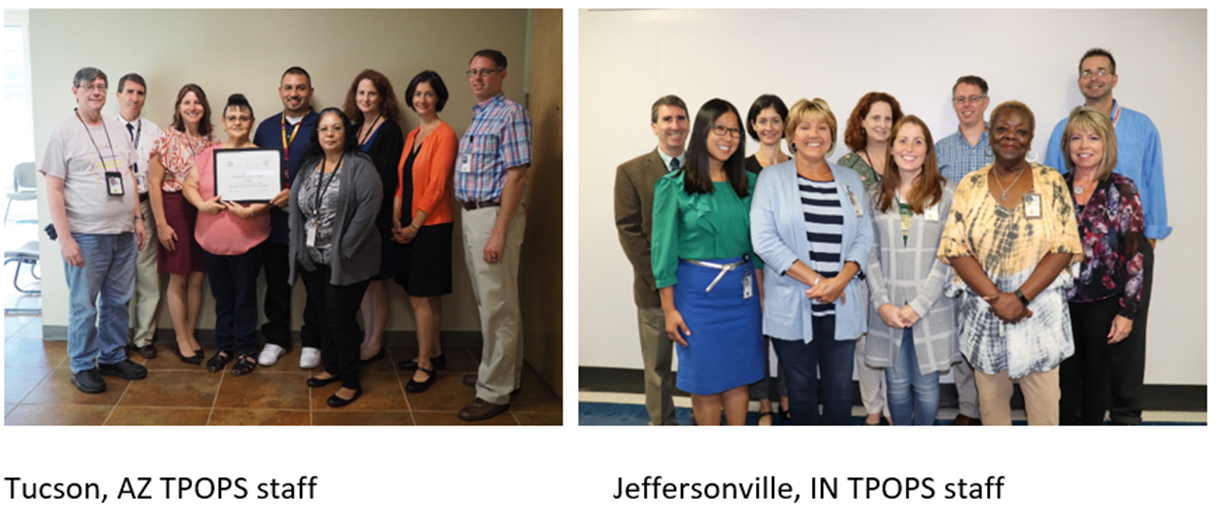
After 23 years and more than 40 million minutes of interviewing time, the Telephone Point of Purchase Survey (TPOPS), the last random-digit dial (RDD) household survey conducted at the Census Bureau, has come to an end. Recognizing that RDD was no longer a sustainable methodology for collecting these data, the Census Bureau and the Bureau of Labor Statistics (BLS) worked to consolidate the collection of point-of-purchase data as part of the Consumer Expenditure Survey effective FY2020.
Nonetheless, fondness for TPOPS runs deep at both agencies – particularly for staff at the Census Bureau Contact Centers, some of whom have worked on TPOPS for decades. It seemed right to take a moment to mark the occasion and celebrate the value of TPOPS over the years as an integral input to the Consumer Price Index (CPI). Staff from BLS and Census visited the Jeffersonville and Tucson Contact Centers in September to thank them for their 23 years of service, and to reflect on the evolution of this important data source.
The purpose of the TPOPS was to collect information on where people purchase goods and services and how much they are spending to get a better idea of the nation’s consumption habits. The data from the TPOPS were used to select the retail establishments in which the BLS monitors the prices of a sample of goods and services for the CPI.
The Point of Purchase Survey, as it was originally called, started in 1974 as a door-to-door household survey. In 1988, BLS and Census began testing telephone interviewing as an alternative to the door-to-door method in use at that time. By 1997, TPOPS was in full production. Instead of an address-based sample, TPOPS incorporated Random Digit Dialing, a telephone number-based sample. Although this data collection methodology was effective early on, the survey suffered from declining response rates as the culture around telephone use changed in the U.S.
After much planning and consideration, BLS decided to integrate the outlet questions from TPOPS within the Consumer Expenditure (CE) Quarterly Interview and Diary Surveys conducted by Census. These two surveys use the computer-assisted personal visit data collection methodology to collect information on what people buy and how much they spend. Two other pieces of information that are vital to the CPI. Integrating the question of “where did you purchase the service or product” into the CE Surveys makes intuitive sense to CE respondents, and makes collection of these important data points much more efficient.
The contribution of the Hagerstown, Jeffersonville, and Tucson TPOPS interviewers and the National Processing Center has been vital to the CPI program over the last 23 years. Thank you for your contribution.
U.S. Census Bureau Releases 2017 Economic Census First Look Estimates
by Jewel Jordan, Public Affairs Specialist, Media Relations Branch, Public Information Office
On September 19, 2019, the U.S. Census Bureau released First Look estimates from the 2017 Economic Census. The Economic Census provides the most comprehensive and detailed statistics on employer businesses available, and serves as the benchmark for nearly every business survey conducted by the Census Bureau.
The 2017 Economic Census is one of the first Census Bureau programs publishing data on the new 2017 North American Industry Classification System (NAICS) basis. While most codes are unchanged from the 2012 NAICS, there were a few industries whose code changed, as well as some industry consolidations and other changes. The 4,374 establishments in the new Research and Development in Nanotechnology industry (NAICS 541713) reported 171,666 employees and $42.0 billion in total revenue.
In 2017, the number of businesses with paid employees increased to nearly 7.6 million, surpassing the 7.1 million establishments in 2012 and the 7.4 million establishments in 2007. These establishments employed over 127.0 million employees with an annual payroll of $6.5 trillion.
“The 2017 Economic Census First Look estimates provide an in-depth look at the economy as a whole,” said Nick Orsini, associate director of Economic Programs at the U.S. Census Bureau. “Future releases will provide data for local geographies including states, counties, metro areas and cities/towns.”
Number of Establishments
- The Retail Trade sector (NAICS Sectors 44-45) continued to account for the largest share of employer establishments, with almost 1.1 million establishments, accounting for 14.0% of all employer establishments.
- The Construction sector (NAICS 23) saw the largest increase in the number of establishments between 2012 and 2017, up 116,874 (19.5%) over this period.
The Economic Census provides detailed data for nearly every 2- through 6-digit NAICS code. While this first look provides data at the national-level, later releases, starting in January 2020, will provide local area data. The preliminary national-level data will be superseded by the national-level data released in later reports.
Employees and Payroll
- The Health Care and Social Assistance sector (NAICS 62) accounted for the most employees, 20.6 million (16.2%) of 127.0 million total employees, and annual payroll, $990.2 billion (15.2%) of $6.5 trillion, of all sectors in 2017.
- The Health Care and Social Assistance sector (NAICS 62) also accounted for the largest growth in payroll at $189.0 billion between 2012 and 2017.
Business Revenue
- Of the 18 NAICS sectors covered by the Economic Census, the Wholesale Trade sector (NAICS 42) ranked 10th in terms of numbers of establishments in 2017 but first in terms of total sales, with $8.5 trillion.
- Insurance Carriers (NAICS 5241) reported the highest total revenue of any industry group in 2017 ($2.1 trillion), followed by Petroleum and Petroleum Product Merchant Wholesalers (NAICS 4247) ($1.1 trillion) and Automobile Dealers (NAICS 4411) ($1.0 trillion). The nation’s 32,195 insurance carriers employed over 1.6 million workers with $146.1 billion in annual payroll in 2017.
- Workers in the Petroleum and Coal Products Manufacturing (NAICS 324) industry generated one of the highest average revenue per employee of any subsector in 2017 ($5.1 million), and this subsector reported one of the highest average revenue per establishment in 2017 ($256.1 million).
For more information on the industries covered (and not covered) by the Economic Census, see Coverage. To review the geographic area changes that will be reflected in local area tables, see Economic Census Geographies. Later data will also be presented by legal form of organization, business size and other detailed dimensions.
The 2017 Economic Census will be one of the first Census Bureau programs released on the new dissemination platform — data.census.gov. To learn more about this platform and our other data tools and programs, visit Census Academy. This site includes recorded webinars on these tools and programs, including one on Transitioning to data.census.gov. To view a release schedule for these 2017 Economic Census data products, see the Release Schedule.
All dollar values are expressed in current dollars, i.e., they are not adjusted for price changes. The data presented in the 2017 Economic Census First Look estimates will be superseded by data released in later 2017 Economic Census releases. For further information about Economic Census methodology and data limitations, see Methodology.
Other Recent Data Releases
September 2019 Releases
American Community Survey Provides New State and Local Income, Poverty and Health Insurance Statistics- The U.S. Census Bureau released its most detailed look at America’s people, places and economy. New state and local statistics on income, poverty and health insurance are available in briefs, detailed tables, data profiles and more. The American Community Survey (ACS) also produces statistics for more than 40 other topics (September 26).
American FactFinder Retires: Data Dissemination Transitions to Data.census.gov- The U.S. Census Bureau has retired American FactFinder (AFF), its statistics and information search engine after 20 years. Users can begin accessing Census Bureau data at data.census.gov, including the 2018 1-Year American Community Survey and 2017 Economic Census later this month (September 20).
Census Bureau Launches Updated 2020 Census Website- The U.S. Census Bureau recently launched a new version of 2020census.gov. The new website adds features, resources and materials to help inform the public about the 2020 Census (September 13).
Census Bureau Releases Schedule for 2017 Economic Census Results- The U.S. Census Bureau releases the planned schedule for the 2017 Economic Census results (September 12).
Congressional District Summary File for 116th Congress Released- The U.S. Census Bureau updated the 2010 Census Congressional District Summary File for the 116th Congress (Jan. 3, 2019 – Jan. 3, 2021). The updated file contains 2010 Census statistics for the 116th congressional district boundaries (September 5).
August 2019 Releases
Geographic Mobility Data for Counties, Metropolitan Statistical Areas and Minor Civil Divisions- The U.S. Census Bureau released migration statistics from the 2013-2017 American Community Survey (ACS). These data tables highlight the geographic mobility of people between counties, metropolitan statistical areas, minor civil divisions in some states, and municipalities (municipios) in Puerto Rico. The five-year data provide estimates of in-migration, out-migration and net migration of movers and nonmovers between origin and destination of these geographies (August 29).
New U.S. Census Bureau Product Shows Detailed E-Commerce Data- The U.S. Census Bureau released the Supplemental Quarterly Retail E-Commerce table. This is a new experimental data product that provides more granular e-commerce estimates (August 28).
Current Population Survey Table Packages Now Available by Sex for Race, Hispanic Origin and Foreign-Born Populations- The U.S. Census Bureau released new tables from the 2017 and 2018 Current Population Survey Annual Social and Economic Supplement (August 19).
U.S. Census Bureau Updates Census Business Builder- The U.S. Census Bureau released improvements to Census Business Builder (CBB). Census Business Builder version 2.6 now includes up-to-date employment data from the Bureau of Labor Statistics (BLS) (August 16).
Page Last Revised - November 18, 2022
✕
Is this page helpful?
 Yes
Yes
 No
No
 Yes
Yes
 No
No✕
NO THANKS
255 characters maximum
 255 characters maximum reached
✕
Thank you for your feedback.
Comments or suggestions?

Comments or suggestions?