
Official websites use .gov
A .gov website belongs to an official government organization in the United States.
Secure .gov websites use HTTPS
A lock (
) or https:// means you’ve safely connected to the .gov website. Share sensitive information only on official, secure websites.

Topics
Data & Maps
Surveys & Programs
Resource Library
Survey News Volume 7, Issue 2
Survey News Volume 7, Issue 2
In This Issue:
- Coming Soon: the 2020 Census!
- Measuring Bullying in the 2019 School Crime Supplement
- Experimenting with Non-Monetary Incentive Approaches in the 2018 National Sample Survey of Registered Nurses
- Development of a New Demographic Edit for CPS
- Methodological Enhancements for the National Survey of Fishing, Hunting and Wildlife-Associated Recreation
- National Health Interview Survey Redesigned Questionnaire Launch
- Fresh Uses for the Management and Organizational Practices Survey Instrument
- Shape your future. START HERE. U.S. Census Bureau Unveils 2020 Census Tagline
- Recent Data Releases
Coming Soon: the 2020 Census!
by Eloise Parker, Assistant Director for Demographic Programs
While the Census Bureau’s Demographic Directorate remains focused on its mission to support the data production needs of its sponsoring agencies, it’s hard not to get excited about the upcoming census. The 2020 Census is less than one year out, and the increased pace and energy is palpable in Suitland and our regional offices. We are committed to balancing the opportunities that the 2020 Census presents – a fresh advertising and community awareness campaign, a modernized platform for data collection, best practices in cybersecurity – and making sure that we continue to deliver service and data quality to our customers without interruption.
In case you missed it, we include the Census Bureau’s April 1, 2019 press release below. The link in this release will take you to the “One Year Out” press event, as well as the 2020 Census advertising and fact sheets. There are no better ambassadors for the 2020 Census than those who understand the importance of our nation’s statistical resources, so please help us get the word out about participating.
Census Bureau Press Briefing Marks One Year Out From Census Day
The U.S. Census Bureau provided an operational update on April 1st on the status of 2020 Census operations, emphasizing the need for innovative, collaborative partnerships to ensure a complete and accurate count of everyone living in the United States. The Census Day 2019 press briefing marked one year out from the official reference day for the census.
“The Constitution requires that each decade, we take a census of the population to determine the number of seats each state will be allocated in the U.S. House of Representatives,” said Census Bureau Director Dr. Steven Dillingham. “To meet that requirement, we go to extraordinary lengths to ensure we count everyone once, only once, and in the right place. We know that the 2020 Census is important to every community. Census data guide how federal, state and local funding for critical services such as schools, fire departments and health care facilities is distributed.”
“Data literally shape the future of your community. That’s why it’s so important that everyone understands that responding to the 2020 Census is safe, easy and important,” Dillingham continued.
Dillingham and Albert E. Fontenot Jr., the associate director for Decennial Census Programs, described how preparations for 2020 Census operations are on track and on budget.
“In 2020, all households will have the option to respond to the census online, over the phone and by mail,” Fontenot explained. “We have successfully completed numerous tests to validate our systems and operations to support these innovations, while ensuring that respondent data remain confidential, and we are ready to conduct the most technologically advanced and accurate decennial census in our nation’s history.”
Dillingham and Fontenot also described how the Census Bureau is working with industry, private-sector and federal partners to get the word out about the importance and safety of responding to the 2020 Census.
Additionally, the 2020 Census is the third decennial census to include a dedicated advertising and communications campaign to increase awareness of the census and to encourage individuals to respond on their own. Dillingham shared how the campaign communications platform, “Shape your future. START HERE.” will be used in advertising, digital marketing and public relations activities.
The promotional and outreach activities that have ramped up over the last year across the nation, ahead of the 2020 Census, included the establishment of state and local complete count committees, diverse partners coming together to reduce the undercount of young children and other historically hard-to-count populations, as well as research to help learn about potential barriers, attitudes and motivators about participating in the census.
Tim Olson, the associate director for Field Operations, highlighted the value of engaging local communities in a successful census operation.
“Our hiring and partnership strategy recognizes that trusted, familiar voices can make a big difference in motivating census participation. Our partners will also play a critical role in helping recruit the thousands of people we will rely on to conduct a complete and accurate census,” Olson said.
Census Bureau officials were joined at the press briefing by Chickasaw Nation Governor Bill Anoatubby, the Annie E. Casey Foundation President and CEO Lisa Hamilton, and American Library Association President Loida Garcia-Febo. These and thousands of other partners play a critical role in the communications and outreach effort.
“An accurate counting of Native Americans is particularly important because of the government-to-government relationship tribes have with the federal government. The federal government has treaty responsibilities to provide education, health care, housing and other services to Native Americans,” said Bill Anoatubby, Governor, Chickasaw Nation. “Therefore, an accurate count of people from each Native American nation or tribe is essential in outlining the details of those responsibilities. We encourage all tribal nations to institute their own initiatives to encourage their citizens’ participation in the 2020 census. Tribal leaders can reach out to citizens and constituents explaining the importance of the census and encouraging participation. By participating, we speak for the generations of native people that preceded us and for those yet to come.”
“An accurate 2020 Census is critical to understanding how kids, families and communities are doing – and informing our decisions as a nation,” said Lisa Hamilton, president and CEO of the Annie E. Casey Foundation, a Baltimore-based national philanthropy that seeks to build a brighter future for America’s children. “We all have a part to play in increasing awareness about the importance and safety of participating and making sure all kids are counted, no matter where they live or where they are from.”
“The American Library Association is committed to helping our communities achieve a fair, accurate and inclusive count because libraries serve everyone,” said Loida Garcia-Febo, president, American Library Association. “With 99 percent of hard-to-count areas located within five miles of a public library, we have a tremendous opportunity to promote equity. We want our communities to know that they can count on libraries to help reach a complete count in 2020.”
The first enumeration of the 2020 Census officially begins January 21, 2020, in Toksook Bay, Alaska. In March 2020, the Census Bureau will mail invitations to respond to nearly every household in the country and activate the online response form. Responses to the 2020 Census are confidential and protected by law and can only be used to produce statistics.
Measuring Bullying in the 2019 School Crime Supplement
by Katherine Mark, Survey Statistician, National Crime Victimization Survey Team
Data collection kicked off for the 2019 School Crime Supplement (SCS) in January. The SCS is a supplement to the National Crime Victimization Survey (NCVS), sponsored by the National Center for Education Statistics (NCES) in partnership with the Bureau of Justice Statistics (BJS), the sponsor of the NCVS. Since 1999, the Census Bureau has collected SCS data in odd-numbered years from January through June. The SCS provides data on student-level experiences in public and private schools at a national level, and contains questions on a wide array of topics including the preventative measures used by the school to deter crime; student perception of rules and equity at school; the presence of drugs and weapons at school; and student experiences with bullying at school.
Over the past few administrations of the SCS, the NCES, BJS, and the Census Bureau have continued to refine its measurement of bullying on the questionnaire. In 2014, the Centers for Disease Control and Prevention and U.S. Department of Education released a uniform definition of bullying for research (//www.cdc.gov/violenceprevention/pdf/bullying-definitions-final-a.pdf). The 2015 SCS included a split-half administration for questions related to bullying which compared two different strategies for integrating the uniform bullying definition into the survey (https://nces.ed.gov/pubs2017/2017004.pdf). The 2017 SCS included refined bullying questions, especially in regard to power imbalance between the perpetrator and victim and repetition of bullying behaviors, to better align with the uniform bullying definition. Up through the 2017 SCS administration, questions about bullying have referred to the term “bullying” in the question text.
For the 2019 SCS, the SCS questionnaire was cognitively tested to remove references to the term “bullying” and instead focus on behaviors used to measure bullying by the uniform bullying definition. The result of cognitive testing was a revised 2019 SCS split-sample questionnaire where approximately 60 percent of respondents receive Version 1 and 40 percent of respondents receive Version 2 of the questionnaire. Version 1 is almost identical to the 2017 SCS questionnaire and aimed at maintaining historic trend data. Version 2 is aimed at reducing respondent bias around the concept of bullying by removing references to the term “bullying” from the items. The overall goal of the 2019 SCS split-sample questionnaire is to examine the bullying rates for each version of the questionnaire and determine the best path forward in the SCS’s measurement of bullying.
For more information about the School Crime Supplement, visit https://nces.ed.gov/programs/crime/surveys.asp.
For more information on bullying and bullying prevention, visit //www.stopbullying.gov/.
Experimenting with Non-Monetary Incentive Approaches in the 2018 National Sample Survey of Registered Nurses
by Carolyn Pickering, Survey Director; Elizabeth Sinclair, Assistant Survey Director; and Renee Stepler, Survey Statistician, Survey of Income and Program Participation & National Sample Survey of Registered Nurses Team
The National Sample Survey of Registered Nurses (NSSRN), sponsored by the National Center for Health Workforce Analysis (NCHWA), has served as the cornerstone of nursing workforce data since the 1970’s. The 2018 NSSRN was the first administration of the survey by the U.S. Census Bureau. The primary modes of data collection were self-response by web instrument and by paper questionnaire returned in the mail. The NSSRN team, with the support of NCHWA, experimented with non-monetary incentives in the 2018 data collection. The primary areas of analysis from the experiment were: operational impacts and cost implications; overall impact on response rates; and timeliness of response.
The non-monetary incentives chosen for the test were a lanyard imprinted with the phrase, “I’m a Nurse! What’s your Superpower?” and a pen in the shape of a syringe embossed with the same phrase. These items were chosen based on feedback received during cognitive interviews that nurses use lanyards and pens on a daily basis at the workplace. The design of the experiment called for sending a lanyard to half the sample in the first mailing. The control group received no incentive. In the fifth mailing, half of non-respondents in the original control group were sent a lanyard and pen.
The use of non-monetary incentives resulted in assembly and mailing challenges for the National Processing Center (NPC). First, more quality control and handling of the incentives was needed at NPC than the team anticipated. Specifically, the lanyards needed to be manually separated upon receipt and the pens required individual inspection for damage in the delivery process. In the future, more specific packaging requirements for the incentive vendor may reduce the amount of manual handling and inspection of the incentives. Next, while not unexpected, the use of non-monetary incentives required the manual assembly of each package in the incentive group. An unanticipated impact was the need to manually stamp postage on the packages due to the thickness of the packages preventing automatic stamping. Finally, the postage cost of each package was higher. Further analysis of cost implications is in progress.
Initial response rate analysis indicates the first mailing incentive group had a statistically significant higher (at p<0.05) overall response rate (AAPOR RR-1) as compared to the no incentive group. In addition, the timeliness of responses was positively impacted by the first mailing incentive. Additional response rate analysis will be completed on various demographic characteristics.
Future research recommended by the NSSRN team includes testing the impact of envelop sizes on response rates and timeliness of response with non-monetary incentive and no incentive groups and testing a small cash incentive against non-monetary incentives.
Development of a New Demographic Edit for CPS
by Greg Weyland, Special Assistant to the Survey Director, Current Population and American Time Use Survey Team
The Current Population Survey just finished the development of a revised demographic edit that processes and creates same sex married and cohabitating couples, in addition to opposite sex couples. Several changes were made to the demographic section of the questionnaire to accommodate this revision. First, the response categories to the “relationship-to-reference person” question were expanded to include same sex and opposite sex spouses and unmarried partners. Additionally, the parent pointer and type questions were revised to remove the references to mother and father, and replaced with “parent 1” and “parent 2” based questions. All of the other demographic questions remained constant.
Major changes were made to the logic algorithm for defining such couples. First, we expanded the logic to accept both opposite and same sex couples. At the time of joining the couples, we did not require consistency between the relationship categories and the gender data. Instead, after all the couples were defined, we added a consistency check to accept all couples where the relationship value for the spouse was consistent with the gender data for the couple. If the couple failed this consistency check, we then applied an edit that assigned either opposite or same sex couples using a random number to decide whether the relationship code or the gender variables would take priority. The Census Bureau’s Social, Economic, and Housing Statistics Division’s researched data from the 2015 National Content Test and the American Housing Survey were used to define the split of the relationship/gender choice.
The edit also included other standard consistency checks as necessary — e.g., individuals with a relationship code of child pointed to the reference person as one of their parents, relationship code consistencies within couples and parent-child pairs, not allowing multiple spouses/partners, etc. One other major change to the edit was to ensure that the parent 1 data pointed to the mother, if available, while the parent 2 information pointed to the father, if available. While this was somewhat problematic – i.e., steps were required so the appropriate data were available for the monthly out-to-in files and that allocation flags for the parent items were correct – we were able to make appropriate adjustments to guarantee the accuracy of the data coming out of the new edit.
Methodological Enhancements for the National Survey of Fishing, Hunting and Wildlife-Associated Recreation
by Chris Stringer, Statistician Demography; Beth Newman, Mathematical Statistician; and Courtney Reiser, Lead Scientist, Survey Methodology Area, Demographic Statistical Methods Division
The National Survey of Fishing, Hunting, and Wildlife-Associated Recreation (FHWAR) is conducted by the U.S. Census Bureau on behalf of the U.S. Fish and Wildlife Service (FWS) in coordination with the Association of Fish and Wildlife Agencies (AFWA).
Like many surveys, the FHWAR faces a growing challenge related to survey costs and budgets. The costs associated with conducting the survey are rising as a function of increasing data collection costs, while the survey’s budget is fixed. As a result, sample sizes have decreased in recent survey years. This presents a challenge for producing quality state-level and national estimates derived from the FHWAR data. To meet this challenge, AFWA, the FWS, and the Census Bureau are considering alternative approaches to conducting the survey.
The survey consists of an Internet pre-screener (with a paper questionnaire sent to nonrespondents) and three waves of data collection conducted approximately the last three quarters of the calendar year. Currently, the three waves use computer-assisted telephone interview and computer-assisted personal interview modes to collect data from households who are deemed eligible for the survey. Data elements collected from the survey are combined to create composite estimates of avidity and expenditures associated with hunting, fishing, and wildlife-watching recreation.
The Survey Methodology area of the Demographic Statistical Methods Division (DSMD) has been working with the FHWAR survey team and FWS to identify potential survey interventions to address the principal challenges faced by the FHWAR survey: balancing surveys costs while achieving sufficient survey response. In order for potential interventions to be fit-for-purpose they need to address these challenges while maintaining operational feasibility. Focusing on the questionnaire design and data collection components of the survey life-cycle, our goal is to identify potential changes to the survey that:
- Align with best practices in survey methodology
- Are informed by survey research literature and operational expertise
- Would not have a deleterious impact on data quality
- Can achieve cost savings by reducing the cost per completed case
- Have the potential to allow for an increase in sample size commensurate with a decrease in cost per completed case, thus leading to more data points within the survey’s budget parameters
- Decrease respondent burden and support an increase in participation
DSMD prepared recommendations for changes to the questionnaire and data collection methods that are believed to be viable options to implement in the next survey cycle. The research conducted by DSMD primarily emphasizes short-term feasibility of survey changes, such as:
- Adopting a sequential mixed-mode data collection protocol, beginning with self-administered modes (web and paper)
- Updating contact materials
- Reducing and simplifying questionnaire content
DSMD also overviewed a forward-thinking research approach to address the larger methodological challenge, i.e., adapting the survey over time to adjust to the changing landscape of survey research. Several other enhancements are being considered, including small-area estimation techniques and new sampling designs. DSMD recommendations are accompanied by a strong endorsement that any enhancements made to the survey, the sampling, and data collection methods be evaluated and further enhanced over time as part of ongoing research to improve the survey.
National Health Interview Survey Redesigned Questionnaire Launch
by Andrea Piani, Assistant Survey Director; Kim Geaghan, Team Leader, National Health Interview Survey Team
The redesign of the National Health Interview Survey (NHIS) questionnaire was successfully launched. The survey sponsor, the National Center for Health Statistics, and the Census Bureau worked together to put the new questionnaire into production.
Following a three-month, split-panel bridge period in the fourth calendar quarter of 2018, the NHIS fully launched its redesigned questionnaire on January 1, 2019. Response to the new questionnaire has been overwhelmingly favorable from the field. The NHIS field representatives (FR) are reporting that the redesigned questionnaire is shorter to administer and is better at holding respondents’ attention. Albeit an early sign, sample adult response rates increased by about 5 percentage points in January over the old design. Also encouraging is that the NHIS FRs are collecting fewer partial interviews and more completed interviews with the new questionnaire.
The new questionnaire design features a significantly streamlined approach, involving a shortened household roster followed by the direct administration of the Sample Adult questionnaire or Sample Child questionnaire. An intermediary family questionnaire was eliminated. This change was implemented so health-related questions can be asked of the randomly selected Sample Adult as close to the beginning of the interview as possible.
The previous design asked numerous family-level, health-related questions that could be answered by any eligible household member. With the redesign, health-related questions can only be answered by the Sample Adult. NHIS field representatives were initially concerned about this new approach. They feared that, when the selected Sample Adult was not the same person who provided the household roster data, reaching this specific respondent could be more challenging. A greater number of appointments and return visits might have been required, and fewer households might have provided answers to health-related questions. However, this change in the interview does not appear to have negatively impacted overall response. In fact, sample adult response rates are up.
In 2017, the production instrument took a median total time of 84 minutes for completed cases, with the Sample Adult section taking a median of 44 minutes to complete and the Sample Child section taking a median of 12 minutes to complete. One goal of the redesign was to shorten the interview while still collecting the key data required by the sponsor. Looking at the redesign interview length for January, the median interview time was 51 minutes for completed cases. The Sample Adult section took a median of 34 minutes to complete and the Sample Child section took a median of 15 minutes to complete. Removing the family section, simplifying the household roster, and streamlining the sample adult section led to a 40% shorter overall interview length. This confirms the reports from field that the instrument is quicker to administer. Sample adult respondents also say the interview is less burdensome and the questions are easier to answer.
In addition, a new post-processing system was developed in conjunction with the creation of the redesigned questionnaire. Data collected during the old-to-new questionnaire bridge period was reformatted and edited, and delivered to the sponsoring agency to prepare the system for production. The joint development of the collection instrument and post-processing system has positioned the survey team to deliver the data without schedule delays, even with a major update to the questionnaire.
Fresh Uses for the Management and Organizational Practices Survey Instrument
by Scott Ohlmacher, Economist, Center for Economics Studies
The U.S. Census Bureau develops instruments to collect information of use to many stakeholders, including businesses. Here, I highlight novel uses of the Management and Organizational Practices Survey (MOPS) collection instrument to evaluate business performance including measuring behavior at a single business, and a tool that can be used by businesses to benchmark their own behavior.
For reference years 2010 and 2015, the Census Bureau conducted the MOPS to measure the use of structured management practices and related topics in the manufacturing sector. The MOPS is a supplement to the Annual Survey of Manufactures (ASM) and can be matched to a variety of high-quality establishment-level performance data collected by the Census Bureau, such as sales, employment and productivity. A team of economists using the MOPS find evidence that the use of these structured management practices can explain approximately 20 percent of the variation in productivity between manufacturing firms. Structured practices are explicit, formal, frequent, or specific applications of practices related to data-driven performance monitoring, target- or goal-setting, and performance incentive-setting.
Published results for the MOPS 2015 include an index of structured management adoption calculated at the industry subsector level, at the state level, and by employment size and establishment age categories, as well as question-level response shares for the population of manufacturing establishments. To construct the index of structured management, each of the 16 management questions on the questionnaire were scored on a normalized scale from zero to one, with one indicating the most structured practice and zero the least structured practice. The establishment’s structured management score was calculated as the unweighted average of the normalized responses for the 16 management questions. For more information on scoring for the MOPS, see the methodology here.
Given that these structured management scores are correlated with outcomes, it is natural that a business utilizing this data might be interested not only in the level of structure in the industry or geographic area, but in the business’ own relative level of structure. To this end, a team of experts on management who partnered with the Census Bureau to develop the MOPS have created a website where businesses can answer the questions from the MOPS and benchmark their own use of structured management practices.
Simultaneously, Brittany Bond, a Ph.D. student at MIT’s Sloan School of Management, adapted the Management Practices portion of the MOPS into a questionnaire called the Management Practices Inventory (MPI) to ask about individual manager practices at a single large multinational company.
Selected Survey Instruments on Management Practices
|
While the MOPS asks a single respondent manager to fill out the questionnaire for an establishment as a whole, the MPI asks individual managers from across different business functions of the participating company about their approach to managing their own teams. Several questions from the MOPS were eliminated or consolidated to ensure that the MPI was general enough that any manager across any business function of a typical large firm could likely interpret the questions, and be able to answer, in the same manner. This reduced the total number of questions from 16 to 10, allowing for comparability across units and teams while maintaining comparability to the MOPS.
Bond’s survey had a participation rate of over 75 percent, meaning that around 500 managers completed the MPI. As with the MOPS, Bond constructed an index of structured management adoption using responses to each of the 10 questions.
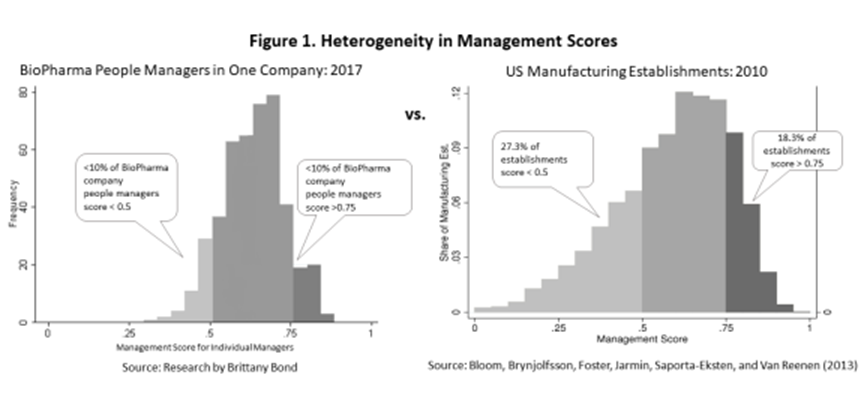
Responses to the MPI indicated that most managers use at least 50 percent of the structured management practices. Less than 10 percent of respondents reported adopting less than 50 percent of the practices. However, adoption is not complete. Less than 10 percent of managers reported that they adopted more than 75 percent of the practices. (See Figure 1.)
Attached to the MPI questionnaire was also a case-based exercise asking respondent managers to reflect on how they manage evaluating an underperforming employee’s work performance. Using the MPI, Bond finds that managers who adopt more structured practices give more accurate evaluations of their employees’ performance.
These fresh applications of the Census Bureau’s MOPS methodology allow businesses to utilize the MOPS to evaluate their own relationships between management practices and performance.
Shape your future. START HERE. U.S. Census Bureau Unveils 2020 Census Tagline
by Kendall Johnson, 2020 Census Integrated Communications Contract
Starting in 1790, and every 10 years since, the United States has conducted a census. Through the data we collect during the decennial census year, we help the public make the decisions they need to improve their community: to build schools, hospitals and new roads; to guide public funding to help those in need; and to help entrepreneurs and businesses make critical decisions.
In about a year, the public will get the chance to respond to the 2020 Census. And before they do, it is our job to make sure they understand that their responses help shape the future of their community.
With a little less than one year to go before April 1, 2020, we announced our tagline for the 2020 Census — “Shape your future. START HERE.” We chose this tagline after our extensive communication research showed that the impact the census has on future generations is a major motivator across different groups to fill out the 2020 Census.

The tagline chosen is a product of the research the agency conducted through the Census Barriers, Attitudes and Motivators Study (CBAMS). The study’s survey reached a nationally representative sample of 50,000 households in early 2018, with nearly 17,500 responses (about a 35.0 percent response rate) to determine who intends to respond to the census and what attitudes, barriers and motivators exist about the 2020 Census. This sample size and response rate are considered well above average relative to the industry standard for communications campaign research. This foundational research demonstrated what types of messages will reach all populations, including segments of the population that are historically hard to count, and which types of messages may motivate individuals to respond to the 2020 Census.
The CBAMS research was paired with expertise of multicultural advertising agencies seasoned in reaching the diverse audience that makes up our nation. These agencies are part of the Census Bureau’s communications contractor VMLY&R. Once developed, the tagline was tested using a combination of online quantitative testing, in-person focus groups, and community representative review sessions with participants — demonstrating that this tagline works in multiple languages and cultures. We are currently building creative materials under the umbrella theme of this tagline and once developed, those creative materials will be tested extensively with diverse audiences around the country. The new tagline and logo will also be distributed to the Census Bureau's partners for use in their materials to align with the campaign.
In preparation for the 2020 Census, on April 1, 2019, Census Bureau Director Dr. Steven Dillingham briefed the public on the status of operations and what they can do to help ensure a complete and accurate count in their community.

Now, with Census Day fast approaching, all of us at the Census Bureau are working diligently in preparation towards the 2020 Census — the most advanced census in our nation’s history. And by taking a few minutes to participate, the public will get the chance to shape their future, starting right here, right now.
Recent Data Releases
March 2019 Releases
2018 Census Test Complete, Prototype Redistricting File Sent to States- The U.S. Census Bureau delivered the Public Law 94-171 Redistricting Data File prototype to all 50 states, the District of Columbia, and Puerto Rico today as part of the final 2018 Census Test requirements. This milestone marks the successful completion of the 2018 Census Test (March 29).
Women’s Earnings by Occupation From the 2017 American Community Survey- In honor of Women’s History Month, the U.S. Census Bureau released a graphic showing median earnings by detailed occupation from the 2017 American Community Survey. The occupation table shows the female earnings for full-time, year-round workers in 2017 and figures on the number of women in select occupations (March 21).
2017 Annual Wholesale Trade Survey- U.S. wholesalers experienced a 5.9 percent increase in sales in 2017, according to estimates from the Annual Wholesale Trade Survey (AWTS) released March 6, from the U.S. Census Bureau. This is the first increase since 2014, from $7.2 trillion in 2016 to $7.6 trillion in 2017 (March 6).
Census Bureau Unveils 2020 Census Communications Campaign Platform- As promotional and outreach activities are ramping up across the nation ahead of the 2020 Census — from establishing local and state complete count committees, to diverse partners coming together to reduce the undercount of children and other hard to count populations — the U.S. Census Bureau announced its long-planned communications campaign platform: “Shape your future. START HERE.” (March 4).
February 2019 Releases
Number of Master and Doctoral Degrees Doubles Among Population- In the last two decades, the number of people with master’s and doctoral degrees has doubled. Since 2000, the number of people age 25 and over whose highest degree was a master’s has doubled to 21 million, and the number of doctoral degree holders has more than doubled to 4.5 million. In 2000, one-third of people with at least a bachelor’s degree had completed an advanced degree. By 2018, that proportion had grown to 37 percent (February 21).
U.S. Census Bureau Streamlines Reporting for Retailers- The U.S. Census Bureau announced an agreement with the NPD Group to make reporting data more convenient, timely and cost-effective for participating retailers. The third-party data provider will deliver regular data feeds to the Census Bureau’s monthly retail programs. The streamlined process will deliver data quicker and with more detail (February 5).
Page Last Revised - December 16, 2021
✕
Is this page helpful?
 Yes
Yes
 No
No
 Yes
Yes
 No
No✕
NO THANKS
255 characters maximum
 255 characters maximum reached
✕
Thank you for your feedback.
Comments or suggestions?

Comments or suggestions?