Survey News Volume 7, Issue 1
Survey News Volume 7, Issue 1
In This Issue:
- 2019 New Year Update
- Pursuing CE Improvements Through Administrative Data
- Looking Ahead to the 2019 American Housing Survey
- National Household Education Survey and the Use of Mail Tracking Data
- Identifying Computer Assisted Telephone Interviewing Outcome-Based Call Limits for the National Survey of College Graduates
- New Study Examines Barriers, Attitudes and Motivators Toward Participating in the Upcoming 2020 Census
- School Engagement Higher for Children Involved in Extracurricular Activities
- Recent Data Releases
2019 New Year Update
by Eloise Parker, Assistant Director for Demographic Programs
While the newsletter was put on hiatus during the Temporary Lapse in Appropriations, we were extremely happy we could keep the Census Bureau’s reimbursable household surveys running without interruptions. I commend the survey teams, Field and Production Center staff who navigated around the parts of the Bureau that were able to keep the survey operations moving. We are also grateful for the flexibility and resourceful thinking on the part of our sponsors as each week presented new challenges. With funding reinstated for the American Community Survey and the Survey of Income and Program Participation (SIPP), things quickly regained a sense of normalcy.
A couple of news items and reminders:
- The next Census Bureau Household Sponsors Meeting is scheduled for Monday, March 11, 2019, 9:30AM – 3:30PM, in the Census Bureau Auditorium. We will make a number of introductions to new staff (or in some cases, old staff in new roles), and share some of the research and experiments underway on different surveys. Also on the agenda is a session on the Census Bureau’s efforts to modernize training for field interviewers, and a session on cross-survey R-Indicators as a way to look at data quality. We look forward to seeing you there.
- The Census Bureau welcomes its new Director, Dr. Steven Dillingham. Dr. Dillingham arrived in low-key fashion during the Temporary Lapse in Appropriations, but he has already shown himself to be highly invested in the work of the Census Bureau, including our household surveys. With his history of leadership in the statistical community that includes Director of the Bureau of Justice Statistics and the Bureau of Transportation Statistics, we look forward to benefiting from his expertise.
- With the arrival of Dr. Dillingham, Dr. Enrique Lamas has transitioned out of his role as Associate Director for Demographic Programs to a new role as Census Bureau Senior Advisor. Dr. Victoria (Tori) Velkoff has assumed the role of Associate Director, bringing with her experience as the Division Chief for the American Community Survey as well as past leadership over the Demographic Directorate’s Population Division and Social, Economic, and Housing Statistics Division.
- We also welcome back Carolyn Pickering as a Survey Director in the Associate Director for Demographic Programs-Survey Operations (ADDP-SO). After a stint as Survey Director for the Consumer Expenditure Surveys and then the Education Surveys, Carolyn moved over to work on prototyping an updated data collection platform for the economic and demographic surveys. We are delighted to have lured her back into the Survey Director role, leading the team responsible for SIPP, the National Survey of Children’s Health (Health Resources and Services Administration, HRSA/Maternal and Child Health Bureau), the National Sampled Survey of Registered Nurses (HRSA/National Center for Health Workforce Analysis), and the National Survey of Psychiatrists (Substance Abuse and Mental Health Services Administration).
- Finally, we have a new Director at the National Processing Center (NPC), Jeff Bryant. Jeff brings a wealth of leadership experience to the complex logistical operations at NPC: prior to the Census Bureau, he was the Director for the Centers for Disease Control and Prevention’s Emergency Operations Division, directing the full scope of emergency preparedness and response in developing countries around the world. Prior to that he served with the Federal Emergency Management Agency and the U.S. Air Force. Jeff brings 34 years of clinical science, emergency management, and senior leadership experience to the Census Bureau.
As we advance further into 2019, you can feel the intensity building around the 2020 Census. Whatever excitement this once-in-a-decade event generates, ADDP-SO is focused on maintaining survey operations through this period. We are also positioning ourselves to take advantage of decennial investments wherever we can – for example, 2020 Census community awareness and advertising efforts, the development of a new data collection platform, and advances in disclosure methods. As we move closer to 2020, we will keep you posted on decennial activities that look like they can benefit the surveys – and for that matter, those that may pose challenges so we can manage our way through them.
See you on March 11.
Pursuing CE Improvements Through Administrative Data
by Brett McBride, Senior Economist, Bureau of Labor Statistics, Consumer Expenditure Surveys Team
In recent years, the Bureau of Labor Statistics, Consumer Expenditure Surveys (CE) program has participated in projects with the Census Bureau’s Center for Economic Studies (CES, formerly Center for Administrative Records Research and Applications), to link survey data with records from separate administrative and commercial sources. Use of these records enables a number of potential survey improvements – variable substitution, the addition of auxiliary variables not collected from respondents, the validation of collected estimates, and processing enhancements (e.g., imputation). To date, administrative data projects have provided CE with information about the measurement error for housing estimates (through a linkage with commercial records) and agreement levels for income as well as the income characteristics of nonresponding sample units (using IRS records).
A review of available administrative data sources led CE to undertake a new project involving records from the Department of Housing and Urban Development (HUD). CES maintains records from two HUD datasets – the Tenant Rental Assistance Center (TRACS) and the Public and Indian Housing Information Center (PIC) – containing subsidized and public housing status, respectively. Due to the small population these records cover, CES is linking five years of CE survey data to the combined TRACS and PIC dataset.
Upon linkage, HUD records will provide information about the potential underreporting of public housing status and the accuracy of tenant-reported rent payments among CE respondents receiving subsidies. Furthermore, CES will investigate how the use of HUD data (in place of respondent reports) will alter estimates for the shelter expenditure category, which is a major component used to calculate poverty thresholds. Finally, CES will resolve questions that remain about the feasibility of using these data. The CE program will learn whether current agreements permit integrating HUD administrative records into survey operations and learn ways to uphold respondent privacy protections in the context of public use microdata releases containing linked data. Given this information, CE will be better positioned to take advantage of the potential found in these administrative records.
Looking Ahead to the 2019 American Housing Survey
by Annie Leung, Survey Statistician, Kenya Tyndle, Assistant Survey Director, Housing Surveys Team
The American Housing Survey (AHS) collects up-to-date information on housing quality and costs in the United States every two years. The survey is sponsored by the Department of Housing and Urban Development (HUD), and they are always looking to add new topics of interest and strengthen the AHS’ status as the leading source of housing statistics. The 2019 survey is scheduled to begin data collection this summer.
For 2019, the survey will include supplemental topics on food security, housing accessibility, and post-secondary education:
- Food security was last asked in the 2015 AHS and includes questions regarding the availability and affordability of food.
- Housing accessibility and modifications made to the home to assist occupants living with disabilities will also be included. These questions are based on the 2011 Housing Accessibility supplement but have been modified to focus on the mobility of the respondent and members of their household.
- Post-secondary education expands on the education questions currently in the core questionnaire. This supplemental topic covers the current enrollment of household members beyond high school and provides more insight into the educational institution.
Concurrent with the 2019 AHS production data collection, the AHS will conduct a telephone follow-on survey on housing insecurity. The concept of housing insecurity is used by researchers, policymakers, and program leaders but it has never been measured in a single consistent way. HUD describes housing insecurity as a significant lapse in affordability, in stable occupancy, or in whether the housing is decent and safe. The term “affordability” in this context implies that shelter costs are manageable over the long term without severely burdening or compromising other consumption that normally is essential for health and well-being. The second element, “stable occupancy,” suggests that the household does not face substantial risk of involuntary displacement for economic or non-economic reasons. Lastly, a unit that has physical attributes that satisfy functional needs for well-being related to health, security, and support for activities of daily living is considered “decent and safe”. Aspects of the neighborhood or environment that one encounters beyond the confines of the structure or property are not included.
The housing insecurity follow-on survey will serve as a research vehicle for HUD to study these concepts and the actual questions as they attempt to develop a consistent measure to track the prevalence of housing security over time. They will also use information collected from the follow-on survey in correlation with housing and other topics like health, education, and employment. The sample for the follow-on survey will be comprised of 4,000 respondents who meet certain criteria based on their responses to the 2019 AHS computer-assisted personal interviewing production questionnaire.
We look forward to the 2019 data collection cycle and expanding on new topics for the housing statistics community.
National Household Education Survey and the Use of Mail Tracking Data
by Allison Zotti and Kayla Varela, Mathematical Statisticians, Center for Optimization and Data Science
The National Household Education Survey (NHES), sponsored by the National Center for Education Statistics, collects information on learning at all ages, with the 2019 collection focusing on young children and school-aged students. The data collection for NHES is conducted in two phases. First, households receive a screener questionnaire asking them to list all the children in the household. Second, if eligible, one of the children is sampled from the screener, and an adult is asked to complete a topical questionnaire about the sampled child. The two primary modes of data collection for NHES: 2019 will be response by web instrument or by paper questionnaire returned in the mail.
To contact the survey sample cases, NHES mails out materials using a combination of United States Postal Service (USPS) delivery and FedEx. The 2019 NHES screener data collection strategy includes an advance letter, an initial survey mail-out primarily consisting of web invitations, and a reminder postcard. The initial survey invitations are followed by up to three subsequent mail-outs. The majority of paper questionnaires are introduced with the third survey invitation mailing. The USPS is used exclusively for the initial contact and advanced mailings. The NHES has traditionally used FedEx to send the third screener survey invitations only. In the 2019 NHES, an experiment designed to assess optimal timing for FedEx will utilize a combination of USPS and FedEx for the 2nd, 3rd, and final screener survey invitation mail-outs.
During the 2019 data collection cycle, NHES will be utilizing intelligent mail barcoding (IMB) on each outgoing and incoming mail piece. IMB is a newer data collection tool that allows surveys to collect information about the current status of their mail pieces in real time. By attaching a unique barcode to each outgoing mail piece, USPS will scan the barcodes at each post office location from the time the mail piece leaves Census’ National Processing Center (NPC) until the final post office location before the mail piece is sent out for delivery. All incoming mail pieces will be barcoded and scanned as well. The Integrated Postal Tracking Service (IPTS) data, which collects information about each scan, is collected by NPC and transferred to the survey team at Census headquarters for analyses and reports. The IPTS data have been collected previously for other surveys, notably the National Survey of College Graduates (NSCG).
NHES is the first survey to collect tracking data from FedEx at Census during data collection. Because NHES uses a combination of USPS and FedEx for a number of their outgoing mail-outs, it’s important that the mail tracking capabilities be utilized through both systems. Through a collaboration between the Associate Directorate for Demographic Programs, NPC, and FedEx, Census established systems to collect the hourly files that will contain the barcode scans from FedEx and to deliver these files to the Center for Optimization and Data Science for analyses and reports. Similar to the IPTS data, the FedEx data include every scan from the time the mail piece is picked up at NPC until the mail piece is delivered to the sample case’s address.
Mail tracking data can be used in a number of different ways to either assess or improve data quality throughout data collection. To confirm a mail-out operation was successful, the number of mail pieces that were expected to be sent out can be compared to the number of mail pieces that have actually entered the tracking systems. A discrepancy in this number can be assessed to determine if action is needed to send additional mail pieces.
For each IPTS scan, the survey team can see where the mail piece is located and at what time. For a national survey, this information is particularly useful for cases further away from NPC, where the mail pieces are sent out. NSCG, which has previously utilized IPTS tracking data during data collection, has shown discrepancies in delivery lag time based upon mail zone. Understanding delivery lag times can help survey staff understand temporal patterns in survey response.
Each mail tracking system also includes a number of exemption codes associated with mail pieces that could not be delivered. This information is helpful in determining reasons for why cases are classified as undeliverable. Having both the IPTS and FedEx data will also show if there are any discrepancies between the undeliverable addresses within each system. For example, a case that has an undeliverable USPS mail piece may have a successful FedEx delivery or vice versa. Tracking this data will help the survey team gain that additional knowledge about their undelivered mail pieces.
As an additional benefit to utilizing the mail tracking data, the NHES survey team will also be able to potentially reduce costs and respondent burden by reducing the number of mail-outs a respondent might receive. For cases that respond to the paper questionnaire, the tracking data will show that a mail piece is being returned as soon as it gets to the first post office in its return journey. For these cases, it is reasonable to assume a complete questionnaire is being returned. So even though the mail piece has not yet reached NPC for check-in, these cases can be pulled from the following nonresponse follow-up mail-out so no additional mail pieces are sent to responding households. Additionally, if a case is shown to have return scans through the IPTS tracking system, but is never checked in at NPC, the survey team can investigate this discrepancy and potentially locate the missing response data.
Overall, the use of mail tracking data is helpful in determining discrepancies in delivery time based on mail zone, locating missing mail pieces, and gaining additional knowledge about undeliverable addresses. For a survey like NHES that utilizes multiple mail systems, USPS and FedEx, incorporating the FedEx data is important for maintaining the completeness of the mail tracking data.
Identifying Computer Assisted Telephone Interviewing Outcome-Based Call Limits for the National Survey of College Graduates
by Renee Reeves, Mathematical Statistician, Demographic Statistical Methods Division
Repeated attempts to contact sample persons can be costly, time-consuming and ultimately unproductive. In 2017, the National Survey of College Graduates (NSCG) experimented with an overall limit of ten Computer Assisted Telephone Interviewing (CATI) calls. This method resulted in significant differences in key estimates and response rates, and prompted the Demographic Statistical Methods Division’s survey methodology area to develop a tailored approach that would reduce the total number of calls by focusing on types of contacts that rarely led to completed interviews. Using data from the 2017 cycle, we identified the most prevalent individual (e.g., ring no answer, fax machine, etc.) and grouped (e.g., unproductive calls, answering machines, etc.) call outcomes, and researched points at which additional calls yielded few completed interviews. We determined the percentage of all CATI cases where a completed interview (using any mode) would not have occurred had each case-level call limit been implemented in 2017. Additionally, as a proxy for cost savings, we determined the average number of calls per CATI case that would not have been attempted had the limits been imposed.
We identified 14 outcomes and four outcome groups that results showed to be the most prevalent (see Figure). The vast majority (83.3 percent) of calls were considered unproductive, with no contact made with the sampled person. Additionally, CATI cases received approximately ten of these unproductive calls on average. The prevalence of unproductive calls (e.g., answering machines, ring no answer, busy signals) provided strong evidence of the potential for cost savings by reducing the number of call attempts.
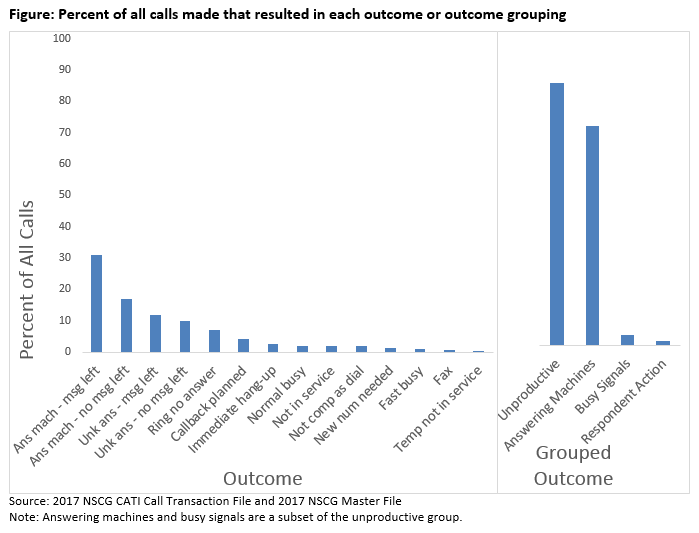
After determining the most prevalent outcomes, we identified the number of completed cases that would not have occurred had each of the limits been imposed, individually and in combination, on the 2017 data. To be conservative, we identified limits that resulted in the percentage of CATI cases considered a lost complete closest to, but not exceeding, 0.01, 0.05, or 0.10 percent. Applying the thresholds to the 14 individual outcomes could have saved between 7,391 and 42,313 calls while only losing between 45 and 408 completed cases, respectively. Additionally, applying these thresholds to the four grouped outcomes could have saved between 1,931 and 15,895 calls while only losing between 13 and 114 completes. At the middle threshold, some of the lowest individual outcome limits were temporarily not in service, new number needed, and immediate hang-up while the highest limits were for answering machines when a message was left, ring no answer, and normal busy signals.
To balance risk and reward, we opted to move forward with the middle threshold of 0.05 percent of CATI cases lost for the 14 individual outcomes and the respondent action outcome group. This threshold was intended to be incorporated into the 2019 NSCG cycle where cases that met any of the limits would be put on hold in the WebCATI system. However, given timing and concerns regarding the interaction with other operational changes in 2019, cases that surpass the limits will be flagged for analysis and potential implementation in future cycles. This research provided a targeted method of limiting CATI contacts, and applying these limits in the future will offer time and cost savings while reducing the risk of eliminating productive calls.
New Study Examines Barriers, Attitudes and Motivators Toward Participating in the Upcoming 2020 Census
by Sarah Evans, Jenna Levy, Jennifer Miller-Gonzalez, Monica Vines, Anna Sandoval Girón, Gina Walejko, Nancy Bates, & Yazmin García Trejo
The U.S. Census Bureau released results on January 24, 2019 from the 2020 Census Barriers, Attitudes and Motivators Study (CBAMS). The national survey and series of focus groups were designed to better understand the nation’s attitudes toward the 2020 Census, potential barriers that may inhibit participation, and possible motivators of responding. The CBAMS research is the foundation for building an Integrated Partnership and Communications campaign for the 2020 Census.
“Every part of the 2020 Census is grounded in research,” Census Bureau Director Steven Dillingham said. “An accurate and complete census relies on U.S. households responding to the 2020 Census online, by phone or by mail, and the communications campaign is key to achieving that.”
This extensive research expands similar work done ahead of the last census and shows how to reach all populations, including segments of the population that are historically hard to count, and which types of messages may be most effective. That work is then reinforced by the testing of the advertising creative to be used throughout the campaign.
January 24th’s release includes two reports: “2020 Census Barriers, Attitudes, and Motivators Study (CBAMS) Final Survey Report” and “2020 Census Barriers, Attitudes, and Motivators Study (CBAMS) Final Focus Group Report.”![]()
The 2020 CBAMS survey reached a nationally representative sample of 50,000 households in early 2018, with nearly 17,500 responses (about a 35.0 percent response rate) to determine who intends to respond to the census and what attitudes, barriers and motivators exist about the 2020 Census. This is considered a well above average sample size and response rate than the industry standard for communications campaign research.
Highlights of the CBAMS Final Survey Report:
- Two-thirds of respondents are “extremely likely” or “very likely” to fill out a census form.
- Many people were unfamiliar with the census, with only 33 percent being “extremely” or “very” familiar. Knowledge about the purpose and process of the census was uneven across groups.
- The analysis revealed five barriers that might prevent people from participating in the census: concerns about data privacy and confidentiality, fear of repercussions, distrust in all levels of government, feeling that it doesn’t matter if you are counted, and belief that completing the census might not benefit you personally.
- Funding for public services was a top motivator across groups, yet less than half of respondents knew that the census is used to determine community funding.

In addition, forty-two focus groups, held across 14 cities, explored potential motivators and barriers to response as well as attitudes toward the census. The focus groups were conducted among all characteristics of hard-to-count populations, including racial and ethnic minorities, people who speak languages other than English, those with low internet proficiency, young people who move frequently or have plans to move soon, rural residents, and populations at risk of low response. In addition, the Census Bureau was able to make some observations about the inclusion of a citizenship question on the census form to 34 of the 42 focus groups because the question announcement happened while the research was being fielded.
Highlights of the Final Focus Group Report:
- Tying participation in the census to community funding and, by extension, the hope for a better future for younger generations was a key motivator.
- Helping people understand the purpose, content and process of the census may increase their participation in the 2020 Census.
- Messaging is needed for how the census directly benefits local communities, now and in the future.
- Providing information about the Census Bureau’s data protection policies will not alone mitigate concerns around privacy and confidentiality.
- Encouraging response from trusted voices within the community may increase participation among people with the greatest distrust in government.
In the coming months, the Census Bureau will announce various communications activities for the 2020 Census using the CBAMS research as a key component across the campaign.
School Engagement Higher for Children Involved in Extracurricular Activities
by Brian Knop and Julie Siebens, Survey Statisticians, Social, Economic, and Housing Statistics Division
A new report, released November 6, 2018, from the U.S. Census Bureau shows that children tend to have higher levels of school engagement when involved in one or more activities, like sports, lessons or clubs.
The report, “A Child’s Day,” found that 42 percent of children who took lessons were highly engaged compared to 33 percent of children who did not. The report also examined school engagement and other measures of child well-being.
Children in poverty were less likely to participate in each of the three extracurricular activities (sports, lessons and clubs) than those not in poverty. Children with a college-educated parent were more likely to be in a gifted program, and less likely to have ever been expelled or repeated a grade.
Other findings include:
- A lower percentage of children in homes that lacked access to sufficient food at some time in the last 12 months were highly engaged in school — 26 percent compared with 38 percent for children in food-secure homes.
- Forty-two percent of school-aged children were involved in sports, 30 percent were involved in lessons, and 28 percent were involved in clubs. Nine percent of children participated in all three extracurricular activities.
A set of four historical figures (and accompanying tables) showing trends over time are also released along with the report. These figures show:
- Extracurricular Involvement by Poverty Status
- Extracurricular Involvement by Sex
- School Outcomes (Gifted Program, Expulsion and Grade Repeat) by Poverty Status
- School Outcomes (Gifted Program, Expulsion and Grade Repeat) by Sex
The report analyzes data from the 2014 Survey of Income and Program Participation (SIPP), a nationally representative panel survey administered by the Census Bureau. School engagement is measured in the report using four questions from the SIPP that ask parents about their child’s school-related attitudes and motivation.
Recent Data Releases
January 2019 Releases
2017 Current Population Survey Annual Social and Economic Supplement Research Files- The U.S. Census Bureau released the 2017 Current Population Survey Annual Social and Economic Supplement (CPS ASEC) Research File. The 2017 CPS ASEC Research File provides income, poverty and health insurance estimates based on previous updates to questions, as well as the redesigned processing system (January 23).
December 2018 Releases
Five-Year Trends Available for Median Household Income, Poverty Rates and Computer and Internet Use- The U.S. Census Bureau announced the release of the 2013-2017 American Community Survey (ACS) five-year estimates, which features more than 40 social, economic, housing and demographic topics, including homeownership rates and costs, health insurance, and educational attainment. The ACS five-year data release produces statistics for all of the nation’s 3,142 counties. It is the only full data set available for the 2,316 counties with populations too small to produce a complete set of single-year ACS estimates (December 6).
U.S. Census Bureau Releases Small Area Income and Poverty Estimates for States, Counties, and School Districts- In 2017, 11.3 percent of counties had a statistically significant increase in median household income compared to 2007, the year before the most recent recession, while 7.5 percent had a statistically significant decrease, according to the new Small Area Income and Poverty Estimates report released by the Census Bureau (December 3).
November 2018 Releases
2018 Geographic Mobility Data Released- The U.S. Census Bureau has released new statistics that highlight geographic mobility at different levels of geographic detail. Geographic mobility and migration both refer to the movement of people from one location of residence to another (November 27).
U.S. Census Bureau Releases 2018 Families and Living Arrangements Tables- Adults in the United States are increasingly delaying saying “I Do” as the median age at first marriage continues to climb, according to new data released by the Census Bureau (November 14).