
Official websites use .gov
A .gov website belongs to an official government organization in the United States.
Secure .gov websites use HTTPS
A lock (
) or https:// means you’ve safely connected to the .gov website. Share sensitive information only on official, secure websites.

Topics
Data & Maps
Surveys & Programs
Resource Library
Survey News Volume 6, Issue 6
Survey News Volume 6, Issue 6
In This Issue
- National Health Interview Survey Redesign Training for Field Representatives
- New Table Creator for the Survey of Market Absorption
- The Annual Social and Economic Supplement Processing System
- Efforts to Reduce Out-of-Scope Rates in the National Ambulatory Medical Care Survey
- Protecting the Confidentiality of America’s Statistics: Adopting Modern Disclosure Avoidance Methods at the Census Bureau
- Improving Our Count of Young Children
- The Opportunity Atlas
- Varying Degrees of Poverty, Thinking Beyond ‘Poor’ and ‘Not Poor’
- Final Census Test Proves Successful
- Recent Data Releases
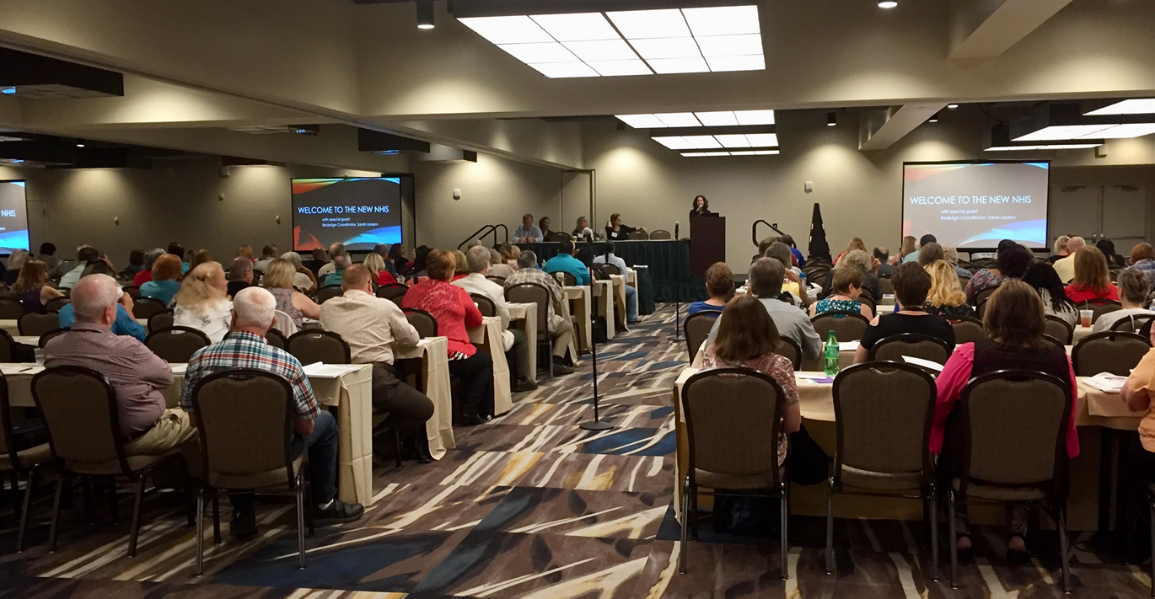
National Health Interview Survey Redesign Training for Field Representatives
by Helen Rosenkrantz and Kelly Holder, Survey Statisticians, National Health Interview Survey Team
The newly redesigned National Health Interview Survey (NHIS), sponsored by the National Center for Health Statistics (NCHS), will launch in January 2019. In order to familiarize NHIS Field Representatives (FRs) and other field staff with the new questionnaire and survey procedures, the NHIS held centralized training in September in New Orleans, Louisiana. The training, conducted in three two-day overlapping sessions, brought together more than 400 experienced NHIS FRs with staff from Census Headquarters, the Census Regional Offices, and NCHS.
During training, FRs heard presentations from Census staff on a variety of topics, including the NHIS’ commitment to data quality and the Performance and Data Analysis (PANDA) tool, using interpreters in the field, tips for navigating the new instrument and important changes to the front and back sections of the instrument.
The NCHS staff gave several talks on the new questionnaire and the flow of the instrument. NCHS experts also reviewed best practices for interviewing techniques such as probing and health term pronunciation, through interactive presentations that emphasized FR participation. They also explained the purpose and use of many of the new sections of the instrument and clarified complex continuing topics, such as health insurance. Experienced FRs collaborated with NCHS staff to demonstrate how they explain the use and importance of NHIS data and respectfully address the concerns of reluctant respondents to “sell the survey.”
And, for the first time in NHIS training, bilingual Spanish-speaking FRs participated in an additional, comprehensive training session which included pronunciation practice of health terminology and focused on strategies for addressing specific challenges of interviewing Spanish language cases.
The training sessions also provided ample time for the FRs to share information and techniques, and interact with senior staff at NCHS, including the NCHS Associate Director for Science, the NHIS Director and other NCHS personnel central to the success of this effort. Field staff expressed particular appreciation for the sponsor involvement, engagement, and the opportunity to train in person with their colleagues.
New Table Creator for the Survey of Market Absorption
by Elke McLaren, Survey Statistician, Housing Surveys Team
The Survey of Market Absorption of New Multifamily Units (SOMA) is a monthly survey which collects data for newly-constructed buildings with five units or more. SOMA collects data on furnished and unfurnished apartments, condominiums, and cooperative units. For each building, SOMA collects the number of each type of unit, amenities, and the number of units that have been absorbed (rented or sold) by pre-designated rental or sale price ranges.
Dating back to 1995, SOMA has published quarterly and annual absorption reports, data tables, and figures. These reports are available on census.gov. Starting in September 2018, SOMA will transition to releasing quarterly and annual data through an interactive tool called Table Creator. This tool allows the data user to designate column characteristics and data sub-groups relevant to their analysis, while ensuring that respondent data is still protected through rounding of estimates and cell suppression.
We released the SOMA Table Creator on September 27, 2018. This release contained quarterly absorption data for 2018 Quarter 1 Completions (buildings completed between January 1 and March 31, 2018) along with all 2017 and 2016 completions. In early December, the absorption data for 2018 Quarter 2 completions will be released. The last release for 2018 will be annual absorption data for buildings completed in 2016. These absorption data were collected in 2017 and an annual report was released in April 2018.
Upon release, the SOMA Table Creator can be accessed through the SOMA website at https://www.census.gov/programs-surveys/soma.html.
The Annual Social and Economic Supplement Processing System
by Lisa Cheok, Survey Statistician, Tim Marshall, Assistant Survey Director, Lisa Clement, Survey Director, Current Population Survey Team
The Annual Social and Economic Supplement (ASEC) of the Current Population Survey (CPS) is used to produce official estimates of income and poverty, and it serves as the most widely-cited source of estimates on health insurance and the uninsured. Data are collected in February, March, and April, with the majority of interviews taking place in March. In 2013 and 2014, new questions were tested to improve estimates for the various sources of income, and on the number of persons covered by health insurance at any time the previous year. Researchers at Westat conducted cognitive testing and arrived at a revised set of questions for the Census Bureau to implement. In 2015, the ASEC contained the new questions for all rotations in the sample.
The changes to the health insurance and income question series were extensive. Changes included:
- Customizing income questions to fit specific demographic groups
- Asking recipiency and amounts separately
- Using targeted questions for certain income categories that are currently not well reported
- Improving health insurance questions by using a new method of collection
- New questions on income-related subsidies for health insurance coverage
- New content on employer-provided health insurance
The updated questionnaire has more detail for both income and health insurance data. Since 2015, the ASEC team has been working on using this new detail to update the editing process. The Social, Economic, and Housing Statistics Division (SEHSD), Income Statistics Branch and Health & Disability Statistics Branch developed updated edit specifications with the assistance of the Associate Directorate for Demographic Programs – Survey Office (ADDP-SO) CPS Team. The Demographic Surveys Division (DSD), CPS Programming Branch programmed the specifications, and in 2017-2018, ran data from previous years through the system. Analysts in SEHSD and ADDP-SO reviewed the new data to verify expected changes.
The first results of the new edit system will represent data collected in 2017, and will be released to the public for academia and other data users as a research file. Another research file will be provided early in 2019, representing data collected in 2018. These research files serve as bridge data between the “old” processing system prior to 2017, and the new system being implemented with the 2019 ASEC.
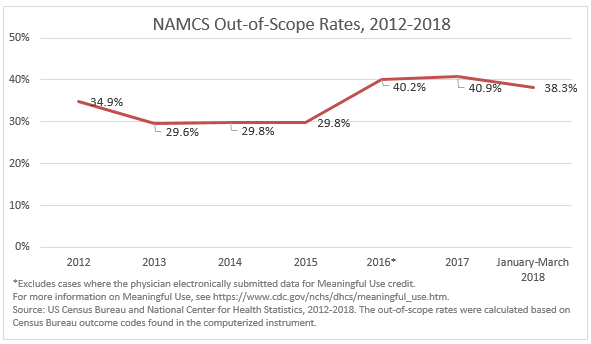
Efforts to Reduce Out-of-Scope Rates in the National Ambulatory Medical Care Survey
by Melissa Kresin, Survey Statistician, National Ambulatory Medical Care Surveys Team
The National Ambulatory Medical Care Survey (NAMCS), sponsored by the National Center for Health Statistics (NCHS), measures ambulatory health care provided in the United States by sampling patient visits to non-federal office-based physicians and federally-funded community health centers. The NAMCS sampling frame is based on a list maintained by NCHS of physicians from the American Medical Association and the American Osteopathic Association.
Since 1989, there have been an average of 3,000 physicians each year in the NAMCS sample, excluding years 2012-2015 where the number of physicians sampled was significantly higher. The NAMCS was designed to collect data that results in estimates that could be generalized to office-based physicians. The survey has a number of criteria that a physician must meet in order to be considered eligible or “in-scope” for the survey and able to participate.
A number of conditions can result in a physician being ineligible or “out-of-scope” for NAMCS, including physicians in military service, physicians who specialize in anesthesiology, radiology or pathology, hospital-based physicians working with outpatient departments and physicians exclusively seeing patients in institutional settings. Since the NAMCS data collection instrument was computerized in 2012, the annual out-of-scope rates ranged from 34.9% in 2012 to 40.9% in 2017. From January to March of 2018, approximately 38.3% of physicians have been found to fall out-of-scope for NAMCS.
There are many reasons the sponsor and survey team would like to reduce these high out-of-scope rates. From a field perspective, field representatives (FRs) are expending resources on a case where ultimately no substantive data will be collected. FRs express a desire to work in-scope cases to maximize their monthly workload and successfully complete an interview. In addition, it is challenging for field supervisors to evenly distribute cases to FRs when four-in-ten cases do not meet the in-scope criteria and take significantly less time to identify and complete than in-scope cases. Also, it is most beneficial for the FRs’ professional development and knowledge of the survey and data collection to be assigned in-scope cases where they can work the case through all stages of data collection, rather than simply identifying cases as out-of-scope and moving on to the next case.
From a survey design perspective, the number of sample cases are determined by data quality thresholds. NCHS provides a sample of about 3,000 cases per year to ensure data on ambulatory care, such as a patients’ reason for visit and source of payment method, are reliable and valid. While the FRs make up for this decrease in sample size due to out-of-scope rates by always aiming to collect high quality data, a larger sample size of in-scope cases would lead to more high quality data being collected and published for data users.
In 2017, focus groups were conducted with FRs to learn more about their experiences in the field, specifically their experiences identifying and flagging out-of-scope cases. In 2018, the survey team and Field organized a session at the annual Regional Survey Manager’s conference to discuss out-of-scope cases with the survey managers who have first-hand experience vetting the sample and researching out-of-scope cases. As a result of this session, Field and the Regional Offices (ROs) created and distributed a document highlighting the resources each RO uses to vet their sample cases prior to FRs receiving their case assignments.
Taking the feedback on out-of-scope cases into account while seeking to increase the in-scope rates and improve data quality, NCHS is using a sampling strategy for the 2019 NAMCS that focuses on two main efforts: 1) removing retired and deceased physicians; and 2) verifying physician’s addresses. A new database at NCHS to track physicians previously designated out-of-scope due to being retired or deceased facilitates the permanent removal of these physicians from the sample starting in 2019. Additional online searches of physicians will also help determine if a physician is still practicing. Secondly, NCHS will verify each physician’s address in an attempt to ensure a valid address is available. Once this sample vetting is complete, a sample file will be delivered to the Census Bureau to continue preparations for 2019 data collection.
We look forward to updating you in 2019 on the NAMCS in-scope rates!
Protecting the Confidentiality of America’s Statistics: Adopting Modern Disclosure Avoidance Methods at the Census Bureau
by Dr. John M. Abowd, Chief Scientist and Associate Director for Research and Methodology of the U.S. Census Bureau
The U.S. Census Bureau’s commitment to data stewardship—protecting respondent privacy and confidentiality at every stage of the data lifecyle—is grounded in law that is straightforward, robust, and strong. From the time we collect the data, through processing, publication and storage, we are bound by Title 13 of the United States Code to ensure that information about any specific individual, household, or business is never revealed, even indirectly through our published statistics.
We call the steps we take to prevent any outside entity from identifying individuals or businesses in the statistics we publish “disclosure avoidance”. This article provides information on the ongoing work at the Census Bureau to modernize how we protect respondent confidentiality when we publish statistics on the U.S. population and economy.
Throughout our history, the Federal statistical community has placed a high premium on statistical data protection, which we call disclosure avoidance. Other statistical agencies use the terms “disclosure limitation” and “disclosure control.” These terms are all synonymous. Disclosure avoidance methods have evolved since the censuses of the early 1800s, when the only protection used was simply removing names. Executive orders, and a series of laws modified the legal basis for these protections, which were finally codified in the 1954 Census Act (13 U.S.C. Sections 8(b) and 9). We have continually added better and stronger protections to keep the data we publish anonymous and underlying records confidential.
However, historical methods cannot completely defend against the threats posed by today’s technology. Growth in computing power, advances in mathematics, and easy access to large, public databases pose a significant threat to confidentiality. These forces have made it possible for sophisticated users to ferret out common data points between databases using only our published statistics. If left unchecked, those users might be able to stitch together these common threads to identify the people or businesses behind the statistics as was done in the case of the Netflix Challenge. 1
The Census Bureau has been addressing these issues from every feasible angle and changing rapidly with the times to ensure that we protect the data our census and survey respondents provide us. We are doing this by moving to a new, advanced, and far more powerful confidentiality protection system, which uses a rigorous mathematical process that protects respondents’ information and identity in all of our publications.
The new tool is based on the concept known in scientific and academic circles as “differential privacy.” It is also called “formal privacy” because it provides provable mathematical guarantees, similar to those found in modern cryptography, about the confidentiality protections that can be independently verified without compromising the underlying protections.
“Differential privacy” is based on the cryptographic principle that an attacker should not be able to learn any more about you from the statistics we publish using your data than from statistics that did not use your data. After tabulating the data, we apply carefully constructed algorithms to modify the statistics in a way that protects individuals while continuing to yield accurate results. We assume that everyone’s data are vulnerable and provide the same strong, state-of-the-art protection to every record in our database.
The Census Bureau did not invent the science behind differential privacy. 2 However, we were the first organization to use it when we incorporated differential privacy into the OnTheMap application in 2008. It was used in this event to protect block-level residential population data. 3 Recently, Google, Apple, Microsoft, and Uber have adopted differentially privacy systems as the standard for protecting user data confidentiality inside their browsers (Chrome), products (iPhones), operating systems (Windows 10), and apps (Uber).
Expanding these hardened and tested confidentiality protections to our flagship products, beginning with the 2020 Census, is a complicated task that the Bureau has taken years to meticulously plan and implement. Nothing on this scope and scale has ever been done before by a statistical agency or a private business.
The first Census Bureau product that will use the new system will be prototype redistricting data from the 2018 Census Test. This confidentiality protection system will provide the foundation for safeguarding all the data of the 2020 Census. It will then be adapted to protect publications from the American Community Survey, economic censuses, and eventually all of our statistical releases. The Census Bureau is equally committed to offering these same privacy protections to data we produce on behalf of our sponsoring agencies, and yet we know that these efforts must take place balancing the important ways in which those data are used. As we continue to develop our capabilities in this arena, we look forward to engaging with you to ensure our products can withstand modern disclosure challenges while maintaining their value for informing on essential program and policy issues.
1. Narayanan, Arvind and Vitaly Shmatikov. 2008. “Robust De-anonymization of Large Sparse Datasets,” SP’08, pp. 111-124. Washington, DC, USA:IEEE Computer Society, DOI:10.1109/SP.2008.33.
2. Dwork, Cynthia, Frank McSherry, Kobbi Nissim, and Adam Smith. 2006. “Calibrating Noise to Sensitivity in Private Data Analysis,” TCC’06, pp. 265-284. Berlin, Heidelberg: Springer-Verlag, DOI: 10.1007/11681878_14.
3. Machanavajjhala, Ashwin, Daniel Kifer, John Abowd, Johannes Gehrke, and Lars Vilhuber. 2008. Privacy: Theory meets Practice on the Map. In Proceedings of the 2008 IEEE 24th International Conference on Data Engineering (ICDE '08). IEEE Computer Society, Washington, DC, USA, 277-286. DOI: 10.1109/ICDE.2008.4497436.
Improving Our Count of Young Children
by Dr. Ron Jarmin, performing the nonexclusive functions and duties of the Director of the U.S. Census Bureau
By conducting the decennial census, the Census Bureau aims to count everyone living in the United States once, only once and in the right place. Over the decades, the Census Bureau has vastly improved its procedures to reduce or even eliminate occurrences of both overcounted and undercounted persons. As in the past, we are taking the lessons learned from previous surveys and studies to ensure a complete and accurate 2020 Census. In particular for 2020, we are well aware of and focused on the problem of undercounting young children ages 0 to 4 — a critical issue highlighted in a recent report by the Annie E. Casey Foundation.
The Census Bureau regularly works with groups like the Casey Foundation, in order to tackle stubborn problems and receive feedback on our initiatives. With the Casey Foundation’s help, and other organizations like it, we are conducting the most robust outreach and marketing effort ever attempted by the Census Bureau for the 2020 Census.
It is an unfortunate fact that the most vulnerable among us — young children — are more likely to be undercounted in the census than any other age group (nearly 1 million children were not counted in the 2010 Census). The Census Bureau has been diligently working for years to ensure that an undercount of this magnitude does not occur again in 2020. Getting an accurate count of young children enables more accurate projections for many critical support service needs, such as education and healthcare.
In 2014, the Census Bureau released a report resulting from a task force analysis that summarized the undercount of young children and recommended research to improve our understanding of the possible causes. Since then, we have been reviewing existing data sources that might provide insights into the circumstances that lead to young children being missed in our surveys.
What we have learned:
- An undercount of young children is not new or unique to the United States. Censuses around the world have struggled with this issue for decades.
- Children living in complex living situations, such as staying with grandparents, other relatives or nonrelatives, are less likely to be counted.
- Respondents in linguistically isolated neighborhoods and destinations for recent immigrants showed more confusion about whether to count a child in their household.
There are many reasons why children are undercounted. Since there is no single cause for the undercount of young children, there is no single solution to the problem. However, we are pursuing multiple strategies, specifically to ensure that the count of young children is as complete as possible:
- We changed the wording on the census questionnaire to help those responding on behalf of their household to include children and babies. We have added the term “grandchild” and tested prompts to list unrelated children. This new wording was tested in the 2018 End-to-End Census Test.
- We are developing materials that explain why young children are undercounted and how organizations and individuals can educate households likely to exclude young children on their questionnaire.
- We are including messaging on the importance of including young children in our communications and partnership support materials.
- We plan to purchase advertising and will have an online presence aimed toward households with young children. We will also partner with advocacy groups focused on children and local community groups who can help us get the word out about the importance of counting all children in the household.
- We are working on a local level. Organizations that focus on children are connecting us with communities through pediatrician groups and advocacy organizations focused on local children. Together, we are getting the word out about counting all children.
- We are working with local schools through our Statistics in Schools program to educate parents about the importance of the census by way of older siblings of these undercounted children.
- We improved our census taker training materials to emphasize the importance of including children during interviews with nonresponding households.
The Census Bureau’s partnerships team is working closely with local and national organizations like the Annie E. Casey Foundation, the Children’s Leadership Council, Child Trends, the Population Reference Bureau and others to generate community awareness on the importance of ensuring these children are counted in the census.
After all, our goal for the 2020 Census is to count everyone — adults and children of all ages.
The Opportunity Atlas
by Raj Chetty, John Friedman, Nathaniel Hendren, Maggie R. Jones, and Sonya Porter, Center for Administrative Records Research and Applications
How do children’s chances of climbing the income ladder vary across neighborhoods in America? Where is opportunity lacking and what can we do to improve opportunity in such areas?
In a new study, we construct a comprehensive census tract-level atlas of children’s outcomes in adulthood using anonymized data covering nearly the entire U.S. population. For each tract, we estimate children’s earnings distributions, incarceration rates, and other outcomes in adulthood by parental income, race and gender. These estimates allow us to trace the roots of outcomes such as poverty and incarceration to the neighborhoods in which children grew up.
All research results are provided in a new publicly available online data visualization tool, the Opportunity Atlas, available at //opportunityatlas.org/, where users can view the data for every census tract in America, overlay their own data points of interest, and export into a data set for their own analysis. Here, we provide a snapshot of this information and discuss some of its potential uses.
To build the atlas, we use de-identified data from the 2000 and 2010 Censuses linked to data from federal income tax returns and the 2005-2015 American Community Surveys (ACS) to obtain information on income, parental characteristics, children's neighborhoods and other variables. We focus on children born between 1978-1983, including those born in the United States and authorized childhood immigrants. Our data capture the characteristics of 20 million children, approximately 94 percent of all children born during the time period.
To construct the measures presented in the atlas, we first analyzed the relationship between child outcomes and the parent household income rank at the national-race-gender level. Some of the outcomes we examined include children’s income (averaged over 2014 and 2015), incarceration rates, and teen birth rates. At the tract-race-gender level, we regress child outcome (e.g., child income rank) on the predicted national value of the outcome for that child’s specific parent income percentile, race and gender. In the regression we include all children of the race-gender subgroup who spent at least one year of childhood in that tract.
To account for children who grow up in more than a single census tract, children are assigned weights in proportion to the fraction of their childhood spent in each tract. Using these regressions, we construct the predicted outcomes for children who grew up in the tract in families at five different points in the parent income distribution (p1, p25, p50, p75 and p99).
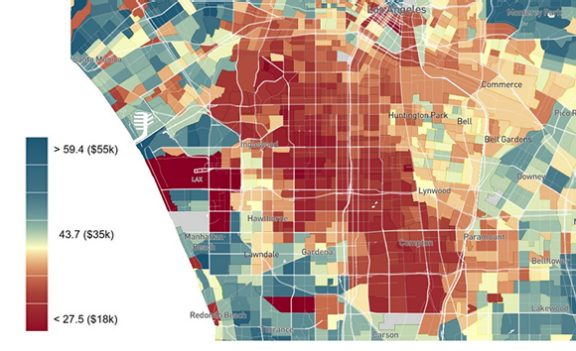
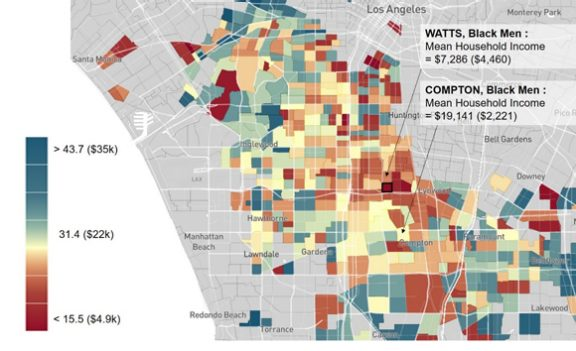
As documented in previous research on commuting zones (CZ), there is wide regional variation in intergenerational mobility based on the broad geography of where children grew up. Our new work finds significant variation even across census tracts within these commuting zones. The standard deviation across CZs of average household income conditional on having parents at the 25th percentile is $3,700. Figure 1 illustrates this variation for the Los Angeles regional area. Within the Los Angeles CZ, we find a standard deviation of about $5,400, illustrating an especially wide variation across neighborhoods within Los Angeles.
Figure 1
Our previous work also documents significant differences in outcomes across racial groups. To illustrate this, Figure 2 provides the estimates for black male individual income for those whose parents were at the bottom percentile of the parental income distribution. We again observe significant variation in individual incomes. For example, in Watts — the same tract as the Nickerson Garden Public Housing Project (census tract #242600) — low-income black males grew up to earn only $7,300 as adults. However, low-income black men growing up in nearby West Compton (tract #542700) earn $19,100 as adults.
Figure 2
We also find substantial heterogeneity across subgroups. The correlation in mean earnings for whites, blacks and Hispanics across tracts conditional on having parents at the 25th percentile is approximately 0.6. As result, places that have poor outcomes for one group do not always have poor outcomes for others.
This new tool has a variety of applications for local policymakers interested in reducing poverty and/or increasing mobility. Policies often either explicitly or implicitly target their intervention by geographic location. Such policies traditionally target large-scale intervention locations based on observed outcomes in an area such as poverty or crime rates. However, the atlas allows policies to be targeted towards areas where children grow up to have low incomes or a high likelihood of being incarcerated. We find that our new measures are only moderately correlated with traditional measures of neighborhood disadvantage, such as poverty rates (e.g. correlation of roughly 0.6 across tracts within CZs).
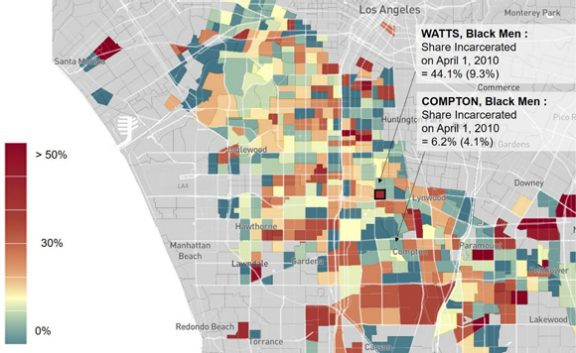
As a result, these new measures provide the potential opportunity to improve outcomes by targeting interventions in childhood, before adult outcomes are realized. To illustrate, Figure 3 documents the geographic concentration of incarceration in the Los Angeles area. Over 40 percent of black men growing up in low-income families in the Watts neighborhood are incarcerated on a single day — the day of the 2010 Census. This contrasts with neighboring Compton, for which only 6 percent are incarcerated. This variation at fine local levels suggests that precision policy targeting to the areas where these children are growing up could be effective for helping reduce incarceration and crime in adulthood.
Figure 3
Another application is in identifying opportunity bargains: neighborhoods that improve children’s outcomes but do not have higher housing costs. This provides potentially useful information both for families seeking neighborhoods with better outcomes for their children and policymakers looking to design affordable housing policies.
To illustrate the presence of opportunity bargains, we first explore the potential extent to which the variation across neighborhoods in the atlas reflects a causal impact of these neighborhoods on adult outcomes. To do so, we study the outcomes of children who move across tracts during childhood.1 We document that for every year a child spends in a tract where they are exposed to residents with higher outcomes, their own adult outcomes are higher. For children who move at age 5 to a place with 1 percentage point higher income ranks, we find they will on average have 0.8 percentage point higher income ranks in adulthood. In contrast, those moving at later ages on average have lower incomes. This suggests that the longer a child spends in a neighborhood with better outcomes, the higher his or her outcomes are in adulthood. Neighborhoods that produce higher incomes for children are not always more expensive. On average, the correlation is positive – Figure 4 shows the relationship between median rents based on the 2015 ACS and children’s household income at age 34 who grew up in those tracts.
Figure 4
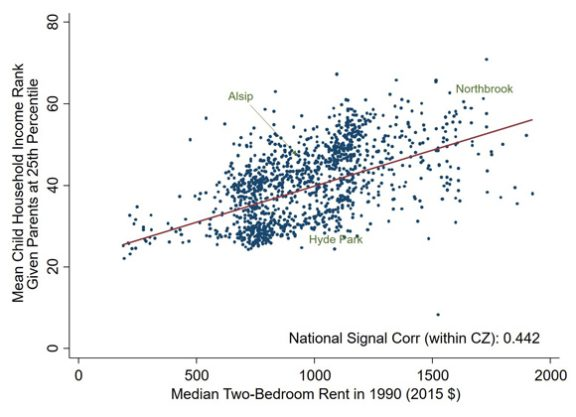
Despite the positive correlation of 0.4, there is considerable variation conditional on rents. This suggests that there are many “opportunity bargains” that generate high outcomes for children but do not have higher cost of living. The evidence on opportunity bargains can in turn guide local policymakers on which policy-driven characteristics of neighborhoods appear to succeed in improving outcomes.
Conclusion
This Opportunity Atlas of outcomes based on the census tracts in which children grew up shows wide variations in incomes and other measures across neighborhoods within commuting zones. This newly available public data provides parents with information to help identify neighborhoods with better outcomes to raise their families and policymakers useful evidence to target place-based interventions with precision. More generally, we hope these maps are useful for understanding the childhood roots of economic success in adulthood.
1The methods and precise definition of causality are discussed in further detail in Raj Chetty and Nathaniel Hendren, “The Impacts of Neighborhoods on Intergenerational Mobility I: Childhood Exposure Effects,” Quarterly Journal of Economics 113 (3), 2018.
Varying Degrees of Poverty, Thinking Beyond ‘Poor’ and ‘Not Poor’
by Ashley Edwards, Poverty Statistics Branch Chief, Social, Economic, and Housing Statistics Division
The concept of poverty is often interpreted as a state of being “poor” or “not poor.” However, identifying one population as “poor” and everyone else as “not poor” oversimplifies the economic circumstances individuals and families face over the year.
In September, the U.S. Census Bureau reported the poverty rate for the United States. In a single statistic the government, service providers and the public will know what percentage of the population was living below the poverty line. However, one way to get a more detailed understanding of how well individuals and families are able to meet their economic needs is by using a measure referred to as an income-to-poverty ratio. Unlike the poverty rate, which reports the proportion of the population living below the poverty level, income-to-poverty ratios gauge how close an individual’s or families’ income is to their poverty threshold.
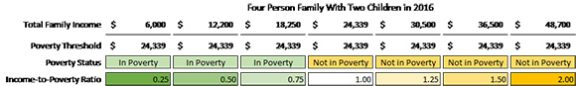
To give an example, in 2016 the poverty threshold for a four-person family with two children was $24,339. If that family had income totaling $12,250 for the year, they would be counted as being in poverty since their total income was less than their poverty threshold. Their income-to-poverty ratio would be calculated as $12,250 divided by $24,339 resulting in an income-to-poverty ratio of 0.50. These values may be shown as ratios, such as 0.50, or converted to a percent (e.g., 50 percent). When an individual’s or family’s income is less than their threshold, their income-to-poverty ratio is less than 1, with ratios nearer to 1 indicating they are closer to meeting their economic needs. Individuals and families with incomes meeting or exceeding their threshold have income-to-poverty ratios equal to (in cases where income is exactly equal to the poverty threshold) or greater than 1, with values greater than 1 representing income that further exceeds the poverty threshold. The table below provides examples at various income-to-poverty ratios for a family of four with two children in 2016, illustrating that while a family making $18,250 for the year and one making $6,000 would both be considered to be in poverty, income-to-poverty ratios provide a more precise understanding of their economic circumstances.
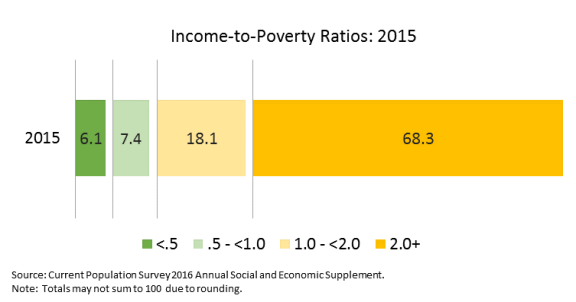
In 2015, 13.5 percent of the population lived in poverty with income-to-poverty ratios below 1 (100 percent of their poverty threshold). A smaller proportion of the population, 6.1 percent, had income-to-poverty ratios below 0.5, meaning their family received less than half of the income necessary to meet their poverty threshold. An additional 18.1 percent of people in 2015 were not considered to be in poverty, but had incomes that were less than 2 times their poverty threshold, while the remaining 68.3 percent of the population had family incomes totaling 2 or more times their poverty threshold. Of the population that experienced poverty in 2015, nearly half (45.1 percent) had income-to-poverty ratios below 0.5.
This year’s income and poverty report came out in September, and while much will be made of the poverty rate, it’s also relevant to consider not just the proportion of people who are in poverty — but how people are distributed across various income-to-poverty ratios.
Final Census Test Proves Successful
by Dr. Ron Jarmin, performing the nonexclusive functions and duties of the Director of the U.S. Census Bureau
In 2020 for the first time in our nation’s history, the Census will be offered online. With less than two years until Census Day on April 1, 2020, we are busy finalizing our preparations as well as testing and retesting every system to ensure the security of all the data we receive.
Counting every person in the country is no easy task — it is the largest peacetime mobilization we undertake as a nation. That’s why the U.S. Census Bureau starts planning each decennial census years before — and the 2020 Census is no different. To conduct the most technically advanced census ever, we researched and tested methods to count everyone in the country accurately, efficiently and securely.
The Census Bureau is nearing the successful completion of our final test — the 2018 Census Test — ahead of the once-a-decade population count. The test examined the critical systems and operations we will be using in 2020. The enumeration phase of the 2018 Census Test took place in Providence, Rhode Island, and built upon lessons learned from 2010 as well as several smaller scale tests we’ve performed since 2013.
The 2018 Census Test’s enumeration activities are complete and the data processing activities are now underway. We rigorously tested each of the three self-response methods that the public will be able to use in the 2020 Census: internet, phone and paper. The test resulted in a slightly higher than expected self-response rate (52.3 percent vs. 49.3 percent) with 61.2 percent of self-responders in Providence using the internet, 7.5 percent using the telephone, and 31.3 percent responding via paper questionnaire. We are very encouraged by these results and by the performance of the systems and technology we’ve put in place for the public to safely and securely respond to the 2020 Census.
Even with the increased options for self-response, we know that some households will still need to be counted the old-fashioned way — by a census taker walking the streets and knocking on doors. However, for the 2020 Census we have vastly improved and modernized the way the thousands of enumerators will work. In Providence, we tested the iPhones that enumerators will use for all aspects of their work including receiving assignments, viewing the most efficient order for visiting each household, submitting their hours, and securely recording, encrypting and transmitting each respondent’s information. All of these technological advances allow us to be more efficient than ever before, without sacrificing respondent privacy or security. Perhaps most encouraging is that we have observed a substantial increase in enumerator productivity from the adoption of technology and automation. In 2010, enumerators completed 1.05 cases per hour worked. In the 2018 test, enumerators completed 1.56 cases per hour worked, a remarkable improvement in productivity.
Importantly, the test was supported by secure IT systems that were successfully deployed in a cloud environment for the first time, which is a major accomplishment. While the 2018 Census Test operations completed thus far proved to be a success, we will be working through the next year to scale our systems to make sure we can perform just as well during the 2020 Census — when we count more than 140 million households nationwide.
Protection of your data is at the forefront of every decision we make at the Census Bureau. To that end, we have designed our IT systems to defend against and contain cyber threats. From the beginning of the data collection process through the final storage of information, we protect your responses following industry best practices and federal requirements, including data encryption and using two forms of authentication to secure system access. The security of our systems is a top priority, and we continually refine our approach to address emerging threats and to position ourselves to prevent, detect, respond and recover from possible cyber threats.
With less than two years away from Census Day 2020, the 2018 Census Test is proving that we are on track and well on our way for the full count — the 2020 Census. Learn more about the 2020 Census here.
Recent Data Releases
October 2018 Releases
New U.S. Census Bureau Research Maps the Roots of Social Mobility- Mapping Interface Provides Neighborhood-Level Information on Children’s Outcomes (October 1).
September 2018 Releases
Health and Well-Being of Older Populations in Three Middle-Income Countries Examined in Census Bureau Report- The U.S. Census Bureau released the Trends in Health and Well-Being of the Older Populations in SAGE Countries: 2014-2015 report, which is based on data from the World Health Organization’s Study on global Aging and adult health (SAGE) (September 25).
International Data Base 2018 Update- The U.S. Census Bureau’s International Data Base update provides demographic revisions for 23 countries. Ten of these countries are in sub-Saharan Africa, six are in Europe, and the rest are in the Middle East, North America, and Latin America and the Caribbean (September 18).
National Processing Center 60th Anniversary Celebration- The U.S. Census Bureau’s National Processing Center (NPC) celebrated its 60th anniversary on September 25, 2018. As part of this historic event, the NPC will hold a job recruitment fair for the 2020 Census (September 18).
New American Community Survey Statistics for Income, Poverty and Health Insurance Available for States and Local Areas- Statistics for More Than 40 Demographic and Economic Topics Provide Detailed Profiles of Communities Nationwide (September 13).
2017 Income, Poverty and Health Insurance Coverage and Supplemental Poverty Measure- Annual release of national-level income, poverty and health insurance coverage statistics. The reports will include statistics for calendar year 2017 and compare trends with previous years (September 12).
NEW! 2017 American Housing Survey Data- The U.S. Census Bureau and Department of Housing and Urban Development released new housing data from the 2017 American Housing Survey (AHS). The biennial AHS is the nation’s most comprehensive housing survey, providing current data on a wide range of housing subjects. Topics unique to the AHS include characteristics and physical condition of the nation’s housing units, indicators of housing and neighborhood quality, and home improvement activities (September 6).
August 2018 Releases
Data for Age, Sex, Race, Hispanic Origin and Foreign-Born- The tables from the 2015 and 2016 Current Population Survey include detailed social and economic statistics for age groups as well as racial groups that include the Hispanic, black or African-American, Asian and foreign-born populations. The foreign-born table package highlights characteristics of the foreign-born population including the characteristics of the foreign-born population by world region of birth and generation (August 29).
Number of Women-Owned Employer Firms Increases- Women-owned employer firms in the United States increased by approximately 2.8 percent in 2016 to 1,118,863 from 1,088,466 in 2015, according to findings from the U.S. Census Bureau’s 2016 Annual Survey of Entrepreneurs (August 13).
Computer and Internet Use in the United States- The report titled “Computer and Internet Use in the United States: 2016” looks at access to computers and broadband internet subscriptions nationwide. Differences can be seen by demographic, social and geographic characteristics across the digital divide between those who have and those who lack access to computers and the internet (August 8).
Page Last Revised - December 16, 2021
✕
Is this page helpful?
 Yes
Yes
 No
No
 Yes
Yes
 No
No✕
NO THANKS
255 characters maximum
 255 characters maximum reached
✕
Thank you for your feedback.
Comments or suggestions?

Comments or suggestions?