
Official websites use .gov
A .gov website belongs to an official government organization in the United States.
Secure .gov websites use HTTPS
A lock (
) or https:// means you’ve safely connected to the .gov website. Share sensitive information only on official, secure websites.

Topics
Data & Maps
Surveys & Programs
Resource Library
Survey News Volume 6, Issue 4
Survey News Volume 6, Issue 4

In This Issue:
- 2019 School Crime Supplement Cognitive Pretesting
- Thinking About Opportunities and Challenges with Integrated Data Processes
- The Post-Enumeration Survey Comes to the ADDP
- 44 Percent of Custodial Parents Receive the Full Amount of Child Support
- In Over Half of U.S. Counties, More Working-Age Men Than Women Are Uninsured
- New U.S. Census Bureau Data Links College Degrees and Earnings
- Recent Data Releases
2019 School Crime Supplement Cognitive Pretesting
by Tim Gilbert, Research Manager, National Crime Victimization Survey
The School Crime Supplement (SCS) is currently undergoing cognitive testing in preparation for implementation in January, 2019. The SCS is a supplement to the National Crime Victimization Survey (NCVS) and is sponsored by the National Center for Education Statistics (NCES) in partnership with the Bureau of Justice Statistics (BJS), the sponsor of the NCVS. The Census Bureau collects the SCS data in odd-numbered years from January through June. The SCS contains questions on a wide array of topics including bullying; preventative measures employed by the school to deter crime; and students' perception of rules and equality in school. The focus of the 2019 SCS cognitive testing is to assess removing the word “bullying” from the bullying questions and instead focus on behaviors used to measure bullying, modernize language on a subset of questions, and refine the Spanish translation.
The SCS instrument has contained a Spanish translation of every question since 2011. Since 2013, the Census Bureau has worked with NCES and BJS to revise many of the SCS questions, specifically questions used to measure bullying. As question wording in English has been updated over the years based on cognitive testing, the Spanish translations have been updated to correspond. However, the SCS has not previously undergone cognitive testing of the Spanish translations.
For the 2019 SCS, a portion of the cognitive testing will be conducted in Spanish, allowing for wording and structure changes to be modified and tested in both the English and Spanish versions of the questionnaire. The results from both English and Spanish cognitive interviews will be assessed together allowing updates to both versions of the questionnaire that promote clarity for both languages. At the conclusion of cognitive testing, a final expert review will be conducted on the wording of the Spanish questionnaire. The overall goal is to produce a SCS questionnaire that communicates effectively in both English and Spanish.
For more information about the School Crime Supplement (SCS), visit https://nces.ed.gov/programs/crime/surveys.asp.
For more information about the National Crime Victimization Survey (NCVS) and supplements, visit https://www.bjs.gov/index.cfm?ty=dcdetail&iid=245.
Thinking About Opportunities and Challenges with Integrated Data Processes
by Jason Fields, Survey Director, Survey of Income and Program Participation
At the Census Bureau, we have been continuing the investigation and development of opportunities to improve our data collection programs using combined sources of information.
There are a few examples we have now successfully implemented on our survey programs. On the data processing side, I’ll talk about using administrative data in editing and imputation for the Survey of Income and Program Participation (SIPP). I’ll discuss how integrated data brings some powerful uses in validation and evaluation. On the data collection side, I’ll focus on the way we are using administrative data in sampling for the National Survey of Children’s Health (NSCH), the National Sample Survey of Registered Nurses (NSSRN), and the National Survey of Psychiatrists (NSP). Finally, I’ll spend a minute on the ways we might add content to surveys without adding burden.
At the recent Federal Committee on Statistical Methodology (FCSM) conference, there were a few presentations that highlighted ongoing work to use model-based imputation of earnings amounts. This research extends our successful implementation of a model-based imputation procedure for SIPP. We use this method to complete the patterns of content when households fail to fully report for all members or all topics. The imputation of patterns of data is not new; SIPP has used matching algorithms to identify donor records for many years. However, the older methods have been largely limited by the ability to match on a limited number of donor characteristics and to the information included in the reported survey data. This leaves the legitimate concern about the impact of non-response processes and the ability to compensate for differential non-response. Nothing in data processing can combat non-response directly, but the advancing methods for model-based imputation bring an important tool for managing the impact of non-response into the toolkit.
The most important features of the alternative sources of data are that they represent different coverage processes and levels of data quality, as well as another window into the distributions of characteristics and their relationship to reported and unreported data. By using the relationships among the sources of data (between cases with administrative data and survey data, and where only one of the two are available), the power of the predictive relationships in model-based imputation extends well beyond the historical methods of imputation. As the FCSM presentations demonstrated, data from IRS W2s are a powerful tool for predicting parts of the earnings distribution. The research proposes ways to utilize these external data, coupled with a robust set of predictors, to improve the imputation of missing data for some components of income. There is more work to do, but this is a very promising example of an avenue for addressing some of the reporting gaps for earned income. The SIPP program and Census continue to research, develop, and increasingly leverage data outside the survey response mechanisms to improve data quality.
The data collection and sample design phases of the survey lifecycle also present some interesting opportunities for leveraging an integrated data approach. The National Survey of Children’s Health (NSCH) is using an address-based frame (the Census Bureau’s Master Address File), supplemented with administrative records-based information to facilitate sampling and screening for households with children. By creating sampling strata informed by this auxiliary data, we are able to increase significantly the likelihood of making contact with households that have children. The resulting sample addresses contain children about 46% of the time, substantially more than the 26% you would expect in a simple random sample. The added efficiency doesn’t sacrifice coverage, either, as the addresses in sample cover over 95% of all children. This use of administrative data makes limited public funding for data collection go farther. Funds can be shifted from screening households that have a low concentration of children over to collecting the vital key indicators in the second-stage topical surveys, allowing us to spend taxpayer dollars as efficiently as possible.
Another example of value gained from integrating multiple data sources can be found in our plans for the National Sample Survey of Registered Nurses (NSSRN). The sample for the NSSRN is compiled from many sources. The universe of nurses comes from the state boards of nursing and the National Council of State Boards of Nursing, but these data are limited to only a few characteristics such as name, address, and license type. These are sufficient to sample with the most basic controls on geography and stratifications on license; however, the sponsor has a goal for making sure that the data collected are representative by state and license type, but also representative for minority populations. Until now there was no option to provide race/ethnicity controls for the nursing population. By adding data from administrative and other sources to the frame of nurses from the state boards, we are able to generate universe-level controls for use in weighting to ensure representative coverage and estimates for the collected survey data. As this procedure is developed for the NSSRN, we are quickly adapting it for similar uses on the new National Survey of Psychiatrists (NSP) that is in development.
A third use of administrative data is in the validation and evaluation of estimates from survey data collections. Especially for SIPP, and the extensive content on program participation and employment, administrative data from IRS, SSA, and other agencies have been critical components in assessing the measurement of the survey estimates. The reengineering of the SIPP data collection instrument relied heavily on these comparisons to determine whether to go forward with the design changes. While limited in coverage to only program participants, or to those earning income subject to FICA, or some other constraint, administrative data provided a third pillar that we used in comparing the results from the new survey instrument to those from the old survey instrument, relative to the administrative data as an external standard. Much as the administrative data serve to improve the imputation discussed above, this application of external data to validation and evaluation is an increasingly valuable tool, and allows the SIPP program to make data-driven decisions about improvements in survey measurement and reductions in non-response bias.
Finally, third party data have always had the attraction of reducing respondent burden by substituting administrative collected content for survey items. We continue to look for opportunities to do this. There are many issues to consider. First, survey responses tell us not just about who participates, but who is eligible but not participating; without the survey data, take-up rates could not easily be calculated. Second, while administrative data are often of much greater quality (especially when it comes to the distribution or payment of funds), they also have data quality areas to consider, in addition to their coverage limitations. That said, there are still opportunities to consider. For the SIPP program, we are interested in expanding the content for data users to include more consumption-related data, but there are precious few survey minutes to spare on these potential questions (we are always looking for ways to shorten the SIPP). One possible option might be to model consumption based on administrative data and survey data from other programs, and develop a synthetic consumption variable(s). If these could be developed and vetted, they would serve the data users’ needs without adding questions to the SIPP interview. Opportunities like this exist on many surveys, and warrant consideration of their place in the information systems.
The Post-Enumeration Survey Comes to the ADDP
by Cassandra Logan, Survey Director, Post-Enumeration Survey Field Operations
The Post-Enumeration Survey (PES) is conducted under the Decennial Coverage Measurement Program. The PES has been in place for more than 60 years under a variety of names (PES in 1990, Accuracy and Coverage Evaluation (A.C.E.) in 2000, Census Coverage Measurement (CCM) in 2010). The major goal of the PES program is to measure the coverage of the Decennial Census by determining the number of people and housing units omitted or erroneously included in the Census.
What is the Associate Directorate for Demographic Program’s (ADDP) role in this Decennial operation? Because the survey was competing with other resources in the Decennial Programs area, planning was being pushed further behind. Decennial made the decision to enter into a ‘Sponsor Agreement’ with ADDP to develop and manage PES Field Operations. With this agreement, the PES will be developed and executed within the same structure as current surveys, expanded to support this new work.
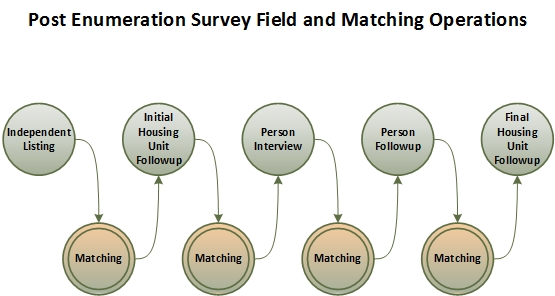
There are three main operations of the PES: Design and Estimation, Field Data Collection, and Matching. The Design and Estimation and Matching operations are still being managed out of the Decennial Directorate, while the Field Operations will be managed out of ADDP-Survey Operations. Although these are distinct components of PES, all of the operations are interconnected and require coordination during the planning, development, and production periods.
Within the Field Operations of the PES, there are five separate data collection components. The first component is Independent Listing (IL), during which listers list each housing unit they encounter in an assigned geographic area. This operation is entirely independent of the Decennial Address Canvassing operation that will take place in the Fall of 2019. The second component is the Initial Housing Unit Followup (IHUFU). During Matching operations, the addresses from IL are matched against the initial Census address list created after Address Canvassing. Nonmatches, potential matches, and potential duplicates are sent to IHUFU for resolution. The third component, Person Interview (PI), collects person-level information for the housing units in sample. These are in-person interviews that use a Blaise computer-assisted personal interviewing instrument to collect information similar to that of the Census and include additional questions to determine if any of the household members could have been counted elsewhere on Census Day. Similar to the process for IHUFU, following Matching operations, additional information is collected during the fourth operation, Person Followup (PFU), to help resolve the match and enumeration status of each person. The fifth and final component is Final Housing Unit Followup (FHUFU). After all the Census operations are complete, the PES list of addresses is matched to the final Census address list. Unresolved matches are sent to FHUFU for resolution. The diagram below illustrates the relationship between the Field and Matching operations.
The results of the PES operations will be used by the Estimation team to produce estimates of coverage errors for both housing units and persons in housing units for the 2020 Decennial program.
We are excited to have this new survey on board in ADDP and hope this is the beginning of many collaborations between the ADDP and the Decennial Directorate.
44 Percent of Custodial Parents Receive the Full Amount of Child Support
by Timothy Grall, Survey Statistician, Economics Program Participation and Income Transfers Branch, Social, Economic, and Housing Statistics Division
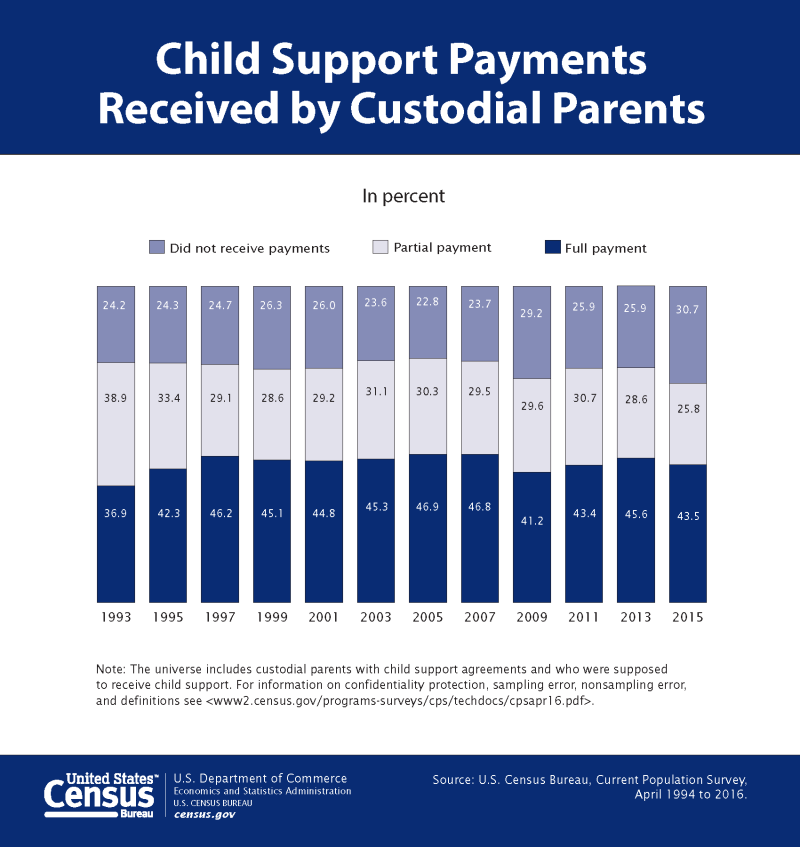
On January 30, 2018 the U.S. Census Bureau released the Custodial Mothers and Fathers and Their Child Support: 2015 report. The Current Population Survey (CPS) provides demographic information about custodial parents, as well as child support and other income or program data for the 2015 calendar year.
Approximately two-thirds (69.3 percent) of custodial parents who were due child support received some payments from noncustodial parents, while only 43.5 percent reported receiving the full amount of child support due.
The report includes demographic and income data about custodial parents and details child support income for custodial parents living below poverty levels. The poverty rate of custodial-mother families in 2015 (29.2 percent) was significantly higher than the poverty rate for custodial-father families (16.7 percent). Of the 1.6 million custodial parents with incomes below the poverty level who were supposed to receive child support in 2015, 39.2 percent received full payments.
Highlights from the report:
- About half (50.2 percent) of all 13.6 million custodial parents had either legal or informal child support agreements. Custodial mothers were more likely to have agreements (52.7 percent) than custodial fathers (39.6 percent).
- The aggregate amount of child support due in 2015 was $33.7 billion, a decrease of $14.0 billion from 2003.
- About 60 percent of the child support due in 2015 was reported as received, averaging $3,447 per year per custodial parent who was due support.
This data comes from the Child Support Supplement to the April 2016 Current Population Survey (CPS).
In Over Half of U.S. Counties, More Working-Age Men Than Women Are Uninsured
by Rachel Upton, Survey Statistician, Social, Economic, and Housing Statistics Division
Working-age men have higher uninsured rates compared with women in over half of all U.S. counties (1,662 out of 3,141 counties) as of 2016. Estimates from the American Community Survey show that in 2016, among the working-age population, the uninsured rate was 13.6 percent for men and 10.5 percent for women, a difference of 3.1 percentage points. Does this gap remain when we look at health insurance coverage at the county level?
To answer that question, we used the U.S. Census Bureau’s Small Area Health Insurance Estimates (SAHIE). The SAHIE program provides the only source of single-year estimates of health insurance coverage status for all 3,141 counties in the United States. SAHIE data can be used to analyze geographic variation and annual trends in health insurance coverage, as well as differences in coverage by race, age, income and sex.
Our analysis focuses on U.S. counties for the year 2016, and also examines differences in health insurance coverage between metropolitan and nonmetropolitan counties. We choose working-age adults (ages 18 to 64) specifically because adults age 65 or over and children under 19 are more likely to have health insurance coverage.
In the majority of U.S. counties, a higher proportion of working-age men than women do not have health insurance. In the remaining counties, there was no statistically significant difference in uninsured rates between the two sexes. Additionally, there was no county where working-age women had a statistically significant higher uninsured rate than working-age men (Figure 1).
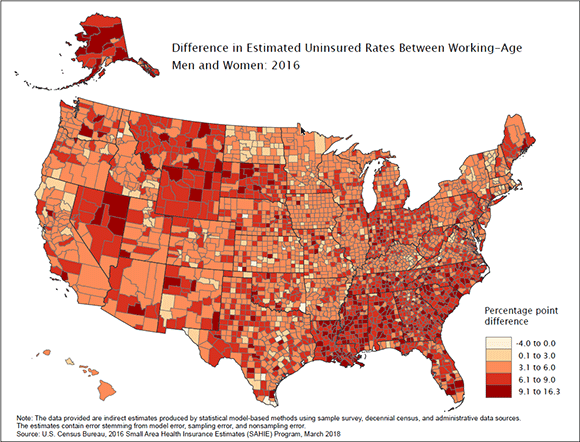
Figure 1. Difference in Estimated Uninsured Rates Between Working-Age Men and Women: 2016
Next, we examined if higher rates of men without health insurance coverage are more prevalent among counties inside or outside of metropolitan areas. According to the Office of Management and Budget, a metropolitan statistical area is a core urban area population of 50,000 or more. In 2016, just over a third of counties were inside metropolitan areas, or what we refer to as “metro counties.” A large majority of counties are farther away from urban areas and usually have small populations; we refer to them as “nonmetro counties.” A larger share of counties in metropolitan areas had higher uninsured rates for working-age men than women. Specifically, 64 percent of counties in metropolitan areas (747 out of 1,168 counties) had higher uninsured rates for men compared with 46 percent of counties in nonmetropolitan areas (915 out of 1,973 counties) as seen in Figure 2.
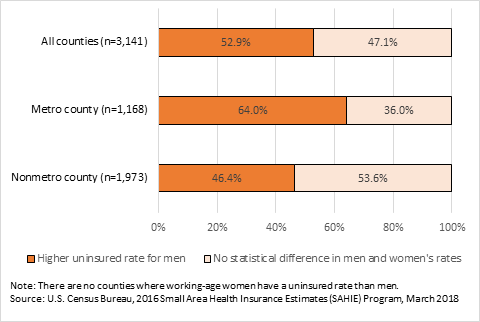
Figure 2. Share of U.S. Counties Where Working-Age Men Have Higher Uninsured Rates by Metro Status
Another point of interest is whether these results change if we account for low-income working-age men and women. The uninsured are disproportionately prone to living at low-income levels. Here we considered a person low-income if they live at or below 200 percent of poverty. Unlike the total working-age population, differences in uninsured rates between low-income men and women were not statistically significant in the majority of counties. Metro areas continued to exhibit a larger share of counties with higher uninsured rates for men relative to nonmetro areas. There was also no county where low-income working-age women had a higher uninsured rate than men (Figure 3).
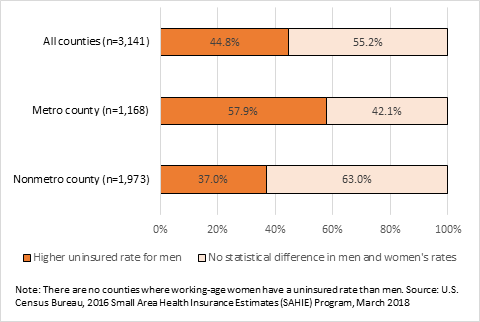
Figure 3. Share of U.S. Counties Where Low-Income Working-Age Men Have Higher Uninsured Rates by Metro Status
Looking at the difference in health insurance coverage between men and women is only one example of how SAHIE data provide timely evaluations of differences in health insurance coverage for all counties. Additional analyses of state- and county-level trends of health insurance coverage status can be found in the 2016 SAHIE report. SAHIE data can be downloaded from the SAHIE application programming interface, offering public access to quality, single-year estimates for U.S. states and counties.
New U.S. Census Bureau Data Links College Degrees and Earnings
The U.S. Census Bureau announced on April 2, 2018 the release of the first data sets from a pilot public-use data product on labor market outcomes for college graduates, offering prospective students a useful tool and a fresh perspective in their considerations of post-secondary education. This release covers graduates from the University of Texas System. A release scheduled for later this year will cover students within the Colorado Department of Higher Education. The Census Bureau’s Post-Secondary Employment Outcomes pilot research program is being conducted in cooperation with higher education institutional systems to examine college degree attainment and graduate earnings. Through agreements with the Census Bureau, Texas and Colorado provided administrative education data on enrollment and graduation provided by their university systems, which the Census Bureau matched with national jobs statistics produced by the Census Bureau’s Longitudinal Employer-Household Dynamics program in the Center for Economic Studies.
“With this pilot, the Longitudinal Employer-Household Dynamics program addresses a major gap in the federal statistical infrastructure for education statistics,” said John Abowd, Chief Scientist and Associate Director for Research and Methodology at the Census Bureau. “Up until now, individual states could only measure earnings and employment outcomes for persons who worked in the same state where they were educated. Thanks to this pilot, states, universities and prospective students have the opportunity to see employment outcomes by program of study by region and industry.”
The Graduate Earnings tabulations provide national-level statistics on annual earnings for graduates by major field, degree level, institution and graduation cohort. The statistics will focus on the 25th, 50th and 75th percentile of earnings at one, five, and 10 years after graduation. The number of graduates in each of these groups will also be published. Statistics will be updated for future graduation cohorts as they become available.
“These statistics provide a much clearer picture of earnings outcomes by college degree and institution,” said Andrew Foote, a Census Bureau economist and lead researcher on the project. “We know that some college graduates move to different states for employment. Now we can see where they go and how much money they are earning. This information offers prospective students an assessment tool to plan their postsecondary education.”
The Census Bureau is working to add additional higher education institution systems to the database.
The Census Bureau will release data on graduate employment outcomes in the coming months. These tabulations will show employment outcomes by region and industry for graduates by educational institution and major.
See Longitudinal Employer-Household Dynamics for more information or visit www.census.gov.
Recent Data Releases
April 2018 Releases
Census Bureau Celebrates 40th Anniversary of State Data Centers Partnership- This year marks the 40th anniversary of the State Data Center Program, one of the U.S. Census Bureau's longest and most successful partnerships. This partnership, created in 1978 between the Census Bureau and the 50 states, the District of Columbia, Puerto Rico and the U.S. Island Areas helps to make Census Bureau data available locally to the public through a network of state, regional and local government agencies; universities; libraries; and chambers of commerce https://www.census.gov/newsroom/press-releases/2018/sdc-40-anniversary.html (April 3).
March 2018 Releases
One in Five Counties See Decrease in Uninsured Rate for the Population Under Age 65- Over one-third of U.S. counties had an uninsured rate of 10 percent or less in 2016, according to new statistics released today from the U.S. Census Bureau. For the population under age 65, the uninsured rate decreased in 20 percent of counties (629 counties) from 2015 to 2016 https://www.census.gov/newsroom/press-releases/2018/sahie.html (March 28).
New Census Bureau Population Estimates Show Dallas-Fort Worth-Arlington Has Largest Growth in the United States- The Dallas-Fort Worth-Arlington metropolitan area’s 146,000-population increase last year was the most of any metro area and Maricopa County, Ariz., saw a population increase of nearly 74,000 — the most of any county last year — according to the U.S. Census Bureau’s July 1, 2017, population estimates released today. The statistics provide population estimates and components of change for the nation’s 382 metropolitan statistical areas, 551 micropolitan statistical areas and 3,142 counties https://www.census.gov/newsroom/press-releases/2018/popest-metro-county.html (March 22).
2016 Annual Retail Trade Survey- The Annual Retail Trade Survey: 2016 provides national estimates of annual sales, e-commerce sales, end-of-year inventories, purchases, operating expenses, inventories held outside of the United States, gross margins, and end-of-year accounts receivable for retail businesses https://www.census.gov/newsroom/press-releases/2018/retail-trade.html (March 21).
Older People Projected to Outnumber Children for First Time in U.S. History- The year 2030 marks an important demographic turning point in U.S. history according to the U.S. Census Bureau’s 2017 National Population Projections. By 2030, all baby boomers will be older than age 65. This will expand the size of the older population so that 1 in every 5 residents will be retirement age https://www.census.gov/newsroom/press-releases/2018/cb18-41-population-projections.html (March 13).
February 2018 Releases
New Current Population Survey/Housing Vacancy Survey Annual Statistics: 2017- The U.S. Census Bureau released annual statistics for the 2017 rental and homeowner vacancy rates, homeownership rates and characteristics of units available for rent for the United States, regions, states and the 75 largest metropolitan statistical areas. Data for all geographies are from the Current Population Survey/Housing Vacancy Survey and are available annually https://www.census.gov/newsroom/press-releases/2018/cps-housing.html (February 27).
2016 Annual Capital Expenditures Survey- The U.S. Census Bureau released the Annual Capital Expenditures Survey report for data year 2016. The survey provides relevant and timely estimates of all nonfarm business expenditures during the year for new and used structures and equipment. Expenditures also include capitalized leasehold improvements and capitalized interest charges on loans used to finance investments. These estimates are provided at the economic sector level, based on the 2012 North American Industry Classification System (NAICS), as well as for industries within those sectors at the NAICS three-digit and selected four-digit levels https://www.census.gov/newsroom/press-releases/2018/aces.html (February 9).
New Census Bureau Data Repository Launched- A new U.S. Census Bureau data repository has been launched as a result of key recommendations made by the 2017 “Report of the Commission on Evidence-Based Policymaking,” in conjunction with the Inter-university Consortium for Political and Social Research (ICPSR). The repository, hosted by the ICPSR, improves transparency by establishing a searchable inventory, through which the public can learn about the data that government collects https://www.census.gov/newsroom/press-releases/2018/repository.html (February 8).
Page Last Revised - October 8, 2021
✕
Is this page helpful?
 Yes
Yes
 No
No
 Yes
Yes
 No
No✕
NO THANKS
255 characters maximum
 255 characters maximum reached
✕
Thank you for your feedback.
Comments or suggestions?

Comments or suggestions?