
Official websites use .gov
A .gov website belongs to an official government organization in the United States.
Secure .gov websites use HTTPS
A lock (
) or https:// means you’ve safely connected to the .gov website. Share sensitive information only on official, secure websites.

Topics
Data & Maps
Surveys & Programs
Resource Library
Survey News Volume 6, Issue 3
Survey News Volume 6, Issue 3
In This Issue:
New Year News
by Eloise Parker, Assistant Director for Demographic Programs
Happy New Year! The year 2018 is a big one for the Census Bureau as it conducts the End-to-End Test and continues to ramp up to 2020 Census. Notwithstanding the demands of the decennial census, the Demographic Directorate continues to enjoy uninterrupted support from IT, statistical, field, production and data processing resources on behalf of our surveys. We are fortunate to have the Associate Director for Demographic Programs (ADDP) Enrique Lamas performing the Bureau’s non-exclusive functions of Deputy Director, as he remains a champion for our sponsors’ needs even as he guides the Bureau through the 2020 Census planning process.
The Demographic Directorate will also be doing its part for the 2020 Census by managing field operations for the 2020 Census Post-Enumeration Survey (PES). We created a special survey team dedicated to this effort led by a new Survey Director, Cassandra Logan. Cass began her career at the U.S. Census Bureau in 2007 as a Survey Statistician with the Immigration Statistics Staff in the Population (POP) Division. Since then, she has served in various capacities within the Demographic Directorate, as a project manager in the Demographic Statistical Methods Division, Acting Assistant Survey Director for the National Survey of College Graduates, and most recently as Assistant Survey Director for the National Health Interview Survey. Cass is a certified Project Management Professional and holds a Ph.D. in Rural Sociology and Demography from Penn State, M.S. in Agricultural Economics from Rutgers University, B.S. in Agricultural Science from Penn State, and a Master’s Certificate in Project Management from George Washington University.
The PES entails a significant investment on the part of the Decennial Program to recruit, hire and train new Field Representatives (FRs) to work on behalf of PES – creating a ready pool of experienced FRs for other surveys once the PES operation is complete. We will be working closely with Decennial over the coming years to identify and analyze how we might leverage other necessary 2020 Census investments such as advertising, community outreach, staff recruitment and equipment to benefit the surveys we support for other Federal agencies.
We are also pleased to welcome Walter Holmes to the ADDP-Survey Operations team. Walter is joining us as a new Assistant Survey Director for the Education Team. He brings a diverse range of experiences to this position, having worked for multiple Decennial programs, Social Economic, and Housing Statistics Division (SEHSD) and POP. He began his Census career in 2005 in the Decennial Management Division (DMD) in the Geographic Programs Branch. Leading up to and during the 2010 Decennial Census, Walter also worked in Field Division and in DMD on the Field Verification, Be Counted and Non-ID programs. Next, Walter spent six years in the Small Area Estimates Branch in the SEHSD working on various projects related to the Small Area Income and Poverty Estimates and Small Area Health Insurance Estimates programs. Finally, he spent the past year in the Decennial Programs Branch in POP working on 2020 Data Products and specifications. Walter earned a Bachelor of Science degree from Mississippi State University and a Master of Arts degree from Georgia State University.
Walter will be filling out the management team on the Education surveys, leading the National Teacher and Principal Survey and the School Survey on Crime and Safety; he will join Christina Cox, who is the Assistant Survey Director over the National Household Education Survey and the Private School Survey. Shawna Cox is currently the Education Survey Director.
Lastly, we have decided to move this newsletter to a quarterly cycle, rather than its current monthly cycle. This will allow us to offer you a publication more centered on survey methods and operations and less on recent data releases (though we will continue to include this information). Look for the next issue of Survey News in April -- we will publish in January, April, July and September.
We are negotiating space for the next Household Surveys Workshop in April. Be on the lookout for communication very soon with the date and time.
Updates from the National Household Education Surveys Program
by Christina Cox, Assistant Survey Director and Tracae McClure, Survey Statistician, National Household Education Survey
The National Household Education Surveys Program (NHES) highlights educational activities from childhood to adulthood within the U.S. population. Data collection for NHES is managed in the Education Surveys Branch at the U.S. Census Bureau and is sponsored by the U.S. Department of Education’s National Center for Education Statistics (NCES). NHES was first collected in 1991 with the goal of providing publicly available data concerning the condition of education in the United States, as reported by household members.
The NHES administration is separated into two stages. First, a sample of households receives a screener, which asks for a list of household members and basic demographic information. If eligible, one of the household members is sampled for either the child or adult survey, called a topical survey. Here are a few highlights from the 2016 NHES administration:
- The Early Childhood Program Participation survey (ECPP), a component of the 2016 NHES administration, collects data about children from birth through age 6 who are not yet enrolled in kindergarten. Data collected from the ECPP indicates that approximately 60 percent of children age 5 and younger were enrolled in a regularly scheduled nonparental care arrangement in 2016 (Corcoran & Steinley, 2017).
- The Parent and Family Involvement in Education survey (PFI), another component of the 2016 NHES, reports data on parent and family involvement in students’ education and homeschool participation. During the 2015-16 academic year, 78 percent of students had parents that reported attending regularly scheduled parent-teacher conferences. Among homeschooled children, 80 percent had parents that reported the environment of schools (i.e. safety, drugs, or negative peer pressure) was the most important reason for homeschooling their child (McQuiggan & Megra, 2017).
- The Adult Training and Education Survey (ATES) is another component of the 2016 NHES. ATES reports data on the nondegree credentials and work experience programs of adults in the United States. In 2016, data collected from the ATES indicated that adults with college degrees were more likely to have additional work credentials than adults with no degree (Cronen, McQuiggan, & Isenberg, 2017).
In 2017, we conducted a NHES web test to refine some methodology and operations for future collections. In this article, we provide an overview of the 2017 NHES web test and results from the usability testing conducted prior to the administration of the web test.
Sample & Methodology
The 2017 NHES web test sample included 97,500 addresses. An incentive, screener, and topical survey experiment occurred during the web test.
- In the incentive experiment, 15 percent of the sample received $2 and 85 percent of the sample received $5. Incentives were mailed with a letter in either a full-size or a letter size envelope.
- In the screener experiment, half of the respondents received a revised screener, whereas the remaining half received the original screener from the 2016 NHES.
- Prior to the 2017 web test, only one topical survey was used per household. In the 2017 web test, a household could receive more than one topical survey. For instance, a household could be eligible to complete two child surveys (ECPP, PFI, and/or PFI-Homeschooled (PFI-HS)). Households were also able to be eligible for one child survey (ECPP, PFI, or PFI-HS) and one adult survey (ATES).
Usability Results
The U.S. Census Bureau’s Center for Survey Measurement (CSM) conducted the usability testing of the 2017 NHES web instrument. Prior to usability testing, CSM’s lab staff conducted three rounds of expert review, providing recommendations for changes to various screen displays across topical sections of the instrument. Grids in the ECPP topical differed from grids in the ATES topical, is one example of the inconsistency among displays. This expert review allowed lab staff to address web survey issues early, which resulted in a more effective usability test.
Results from the usability test showed a number of potential challenges with the 2017 web instrument. One major challenge was that participants sampled to receive two topical surveys would have experienced repetitive questions about the household. For instance, respondents completing two child surveys were asked to enter the number of times that the family ate an evening meal together in the past week on each topical survey. As well, respondents had to answer repeated background questions regarding parental marital status, ethnicity, race, education, relationship to the child, and age on each topical survey.
Another issue discovered during the usability test highlighted inconsistencies with the web instruments’ performance on various mobile devices. For instance, when asked to enter date of birth, iPhone devices defaulted to a wheel when displaying month, day, and year values, whereas Android phones required the respondent to select from a dropdown list. Furthermore, the dropdown menus for date of birth did not work on Windows phones or tablets.
Recommendations
Results from the usability test in preparation for the 2017 web test indicated respondents experienced difficulty with mobile device compatibility as well as frustration with repetitive questions when completing two topical modules. As a result, the following improvements were made to the 2017 instrument: 1) many of the repeated questions were eliminated; and 2) the instrument was further optimized for mobile use. Major changes are occurring as a result of survey development for the NHES 2019 administration and results of the experiments in the 2017 web test. Further usability testing will occur to refine the 2019 NHES web instrument. The aim of these changes will be to improve the respondents’ experience and ultimately maintain or increase NHES’ response rate of approximately 49 percent.
References
Corcoran, L., and Steinley, K. (2017). Early Childhood Program Participation, From the National
Household Education Surveys Program of 2016 (NCES 2017-101), National Center for Education
Statistics, Institute of Education Sciences, U.S. Department of Education. Washington, DC.
Cronen, S., McQuiggan, M., and Isenberg, E. (2017). Adult Training and Education: Results from
the National Household Education Surveys Program of 2016 (NCES 2017-103), National Center
for Education Statistics, Institute of Education Sciences, U.S. Department of Education.
Washington, DC.
McQuiggan, M. and Megra, M. (2017). Parent and Family Involvement in Education: Results
from the National Household Education Surveys Program of 2016 (NCES 2017-102). U.S.
Department of Education. Washington, DC: National Center for Education Statistics.
Gross Rents Continue to Rise
by Mary Schwartz, Housing Statistics Branch, Social, Economic, and Housing Statistics Division
The nation experienced an overall average increase of $21 in median gross rent according to statistics released from the 2012-2016 American Community Survey five-year estimates, compared to 2007-2011 American Community Survey five-year estimates results, which have been adjusted for inflation.
Gross rent is the contract rent plus the estimated average monthly cost of utilities (electricity, gas, and water and sewer) and fuels (oil, coal, kerosene, wood, etc.) if these are paid by the renter (or paid for the renter by someone else). Gross rent eliminates the differences resulting from a variety of practices associated with including utilities and fuels as part of the rental payment. The estimated costs of water, sewer and fuels are reported on a 12-month basis but are converted to monthly figures for the tabulations.
Changes in metropolitan gross rents
Of the 382 metropolitan areas in the United States, the median gross rent in 156 did not change between 2007 to 2011 and 2012 to 2016, and seven would not allow for comparison due to boundary changes. Of the 219 that did change, increases outnumbered decreases four to one with 175 increases and 44 decreases.
- San Jose-Sunnyvale-Santa Clara, California, was among the metro areas with the greatest increase in gross rent, with an increase of $246 from 2007 to 2011 to 2012 to 2016 (from $1,555 to $1,801).
- Carson City, Nevada, experienced one of the largest decreases in gross rent, with a decrease of $158 (from $985 to $827).
The 50 most populous metropolitan areas mirrored all metros in that increases outnumbered decreases four to one with 32 increases, eight decreases, and nine had no changes.
Comparisons for the Los Angeles-Long Beach-Anaheim, California, metropolitan area cannot be made due to boundary changes.
Changes in micropolitan gross rents
Of the 551 U.S. micropolitan areas, the median gross rent in 360 did not change between 2007 to 2011 and 2012 to 2016 and 45 would not allow for comparisons due to boundary changes.
Of the 146 that did change, increases outnumbered decreases more than two to one with 107 increases and 39 decreases.
- Among the micropolitan areas with the highest increases in gross rent was Andrews, Texas, which had a $352 increase (from $608 to $960).
- Clewiston, Florida, had one of the largest decreases in gross rent, with a decrease of $152 (from $844 to $692).
County-level gross rent changes
In the 264 counties with 250,000 or more people, the median gross rent in 79 did not change between 2007 to 2011 and 2012 to 2016. Of the 185 that did change, increases outnumbered decreases by more than four to one with 151 increases and 34 decreases.
- At $252, Santa Clara County, California, had one of the greatest increases in gross rent (from $1,561 to $1,813).
- Among this group, Clark County, Nevada, had one of the largest decreases in gross rent with a decrease of $108 (from $1,121 to $1,013).
In counties with between 125,000 and 249,999 people, 136 of the 232 counties had gross rents that did not change between 2007 to 2011 and 2012 to 2016. Of the counties with changes, increases outnumbered decreases almost four to one with 76 increases and 20 decreases.
- Midland County, Texas, with an increase in gross rent of $248 (from $900 to $1,148) was among the counties with the highest increases in gross rent.
- Among the counties with the largest decreases was Mohave County, Arizona, which had a $95 decrease (from $886 to $791).
- Note that the 2007 to 2011 estimates of gross rent for Midland County ($900) and Mohave County ($886) are not statistically different from each other.
In counties with 65,000 to 124,999 people, 196 of the 315 counties had gross rents that did not change between 2007 to 2011 and 2012 to 2016. Of the counties with changes, increases outnumbered decreases five to one with 100 increases and 19 decreases.
- With an increase in gross rent of $295 (from $666 to $961), Ward County, North Dakota, was among the counties with the greatest increases.
- Newton County, Georgia, had one of the greatest decreases, with gross rent decreasing $105 (from $999 to $894).
In counties with 50,000 to 64,999 people, 126 of 169 had median gross rents that did not change between 2007 to 2011 and 2012 to 2016. Of the counties with changes, increases outnumbered decreases more than four to one with 35 increases and eight decreases.
- Broomfield County, Colorado, was among the counties with the greatest increase in gross rent, with an increase of $312 (from $1,105 to $1,417).
- With a decrease of $158, Carson City, Nevada, (a county equivalent) was among the counties with the greatest decrease in gross rent (from $985 to $827).
In counties with 35,000 and 49,999 people, 241 of 322 counties had gross rents that didn’t change between 2007 to 2011 and 2012 to 2016. Of the counties with changes, increases outnumbered decreases 2 to 1 with 56 increases and 25 decreases.
- Among the counties with the largest increase was Isle of Wight County, Virginia, which had an increase in gross rent of $208 (from $811 to $1,019).
- Among the counties with the largest decrease was Hendry County, Florida, which had a decrease of $152 (from $844 to $692).
- Note that the 2007 to 2011 estimates for Isle of Wight County ($811) and Hendry County ($844) are not statistically different from each other.
In counties with 20,000 to 34,999 people, 425 of 535 counties had median gross rents that did not change between 2007 to 2011 and 2012 to 2016. Of the counties with changes, there were at least twice as many increases as decreases — 79 increases versus 31 decreases.
- Williams County, North Dakota, had one of the greatest increases in gross rent with an increase of $310 (from $605 to $915).
- With a decrease of $227 (from $1,227 to $1,000), Plaquemines Parish, Louisiana, was among the counties with the largest decrease in gross rent.
- Note that the 2012 to 2016 gross rent estimates for Williams County ($915) and Plaquemines Parish ($1,000) are not statistically different from each other.
In counties with less than 20,000 people, 1,026 of 1,305 counties had median gross rents that didn’t change between 2007 to 2011 and 2012 to 2016 and two (Cottle and Loving County, Texas) where comparisons could not be made due to boundary changes. Of those counties whose median gross rent changed, nearly three times as many counties had increases as decreases, 206 versus 71.
- Among counties with the largest increase in gross rent was McKenzie County, North Dakota, which had an increase of $397 (from $498 to $895).
- Among counties with the largest decrease was Daggett County, Utah, which had a decrease of $540 (from $878 to $338).
These results were compiled to provide communities with important statistics to measure housing affordability. These data help determine whether adequate housing is affordable for residents, provide and fund housing assistance programs. They also help enforce laws, regulations and policies designed to eliminate discrimination in private-market housing, government programs and in society.
In addition, the Department of Housing and Urban Development uses these data to establish Fair Market Rents used to determine the level of tenant subsidies in housing assistance programs.
Examining the Effect of Off-Campus College Students on Poverty Rates
by Craig Benson and Alemayehu Bishaw, Poverty Statistics Branch, Social, Economic, and Housing Statistics Division
The U.S. Census Bureau’s American Community Survey 5-year estimates give users the tools and ability to ask and answer many questions. One interesting question is how different populations affect an area’s poverty rate.
For example, how do college students, specifically students living off-campus, affect poverty rates in the places they live while enrolled in school? Earlier Census Bureau research investigated the impact of off-campus college students on community poverty rates and found that smaller communities were more likely to have poverty rates affected by students. (Students living on campus are not included in the poverty universe and therefore do not impact poverty rates).
Using data from the 2012-2016 American Community Survey five-year estimates, we have updated this research with the release of two tables that list all counties and places with more than 10,000 residents where the presence of off-campus students significantly impacts poverty rates. The findings, similar to earlier research, show that the presence of large numbers of off-campus college students can affect an area’s poverty rate.
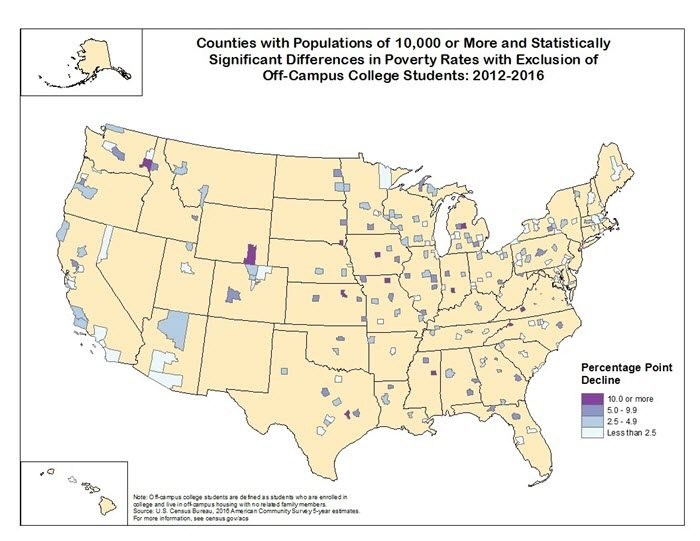
Source: 2012-2016 American Community Survey 5-year Estimates.
The map and detailed tables online display all counties with populations above 10,000 that had statistically significant differences between their original poverty rates and their rates when adjusted to exclude college students living off campus.
Of the 2,437 counties in the United States with populations above 10,000, 211 counties (8.7 percent) had statistically significant decreases in their poverty rate when excluding off-campus college students. Excluding off-campus college students did not result in increased poverty rates in any of these counties. We find poverty rates are impacted by off-campus students in both small counties that house large universities, as well as in some of the largest counties in the United States, many of which are home to multiple colleges and universities. In fact, 87 of the 100 largest colleges and universities based on on-site enrollment are located within these 211 counties.
The map shows a geographic representation of the 211 counties with statistically significant changes. The majority of these counties had decreases of 5 percentage points or less (157 counties or 74.4 percent of all counties that experienced a decline). A smaller number of counties had a 10 percentage point or more decrease from the original poverty rate (16 counties or 7.6 percent of all counties that experienced a decline). These counties with the largest differences tended to have smaller total populations.
An additional table shows places with populations greater than 10,000 people that had statistically significant differences between their original and adjusted poverty rates. Of these 3,943 places, 226 (5.7 percent) had significant declines in poverty rates with the exclusion of off-campus college students. Poverty rates did not increase for any of these places as a result of excluding off-campus college students. Of the 100 largest on-site enrollment colleges and universities, 81 were located in places that showed a significant impact of college students on poverty rates.
The estimates and figures presented here are designed to stimulate further thought about how college students impact poverty rates, and how those estimates might be interpreted in those communities. In a number of areas, the inclusion of off-campus students had a statistically significant effect on local poverty rates, in some cases increasing the rate by 10 or more percentage points.
The Federal-State Cooperative for Population Estimates: A Partnership in Population Expertise
by Kevin Barragan, Federal-State Cooperative for Population Estimates Liaison, Population Division
Accurate population estimates matter. Population estimates from the U.S. Census Bureau help determine how more than $675 billion in federal dollars are distributed each year. States and local governments rely on this funding to provide critical services to residents. Designated state agencies play a key role in our production of population estimates through a program called the Federal-State Cooperative for Population Estimates (FSCPE). This year marks the 50th anniversary of the partnership between the FSCPE and the Census Bureau.
Estimating the population at the subnational geographic level presents many unique challenges. Having access to a network of local demographic experts is helpful because every state is different. FSCPE members possess specialized local knowledge that makes it less challenging to produce accurate estimates for their states. For example, they share vital statistics data and information on group quarters such as college dorms and prisons. The Population Estimates Program (PEP) at the Census Bureau incorporates this information with its other data inputs to produce current population estimates consistent with the last decennial census counts. The FSCPE members then support PEP by reviewing and providing feedback on the population and housing unit estimates and methodology. The Census Bureau and state members find this process extremely valuable.
“A benefit to the states involved with the estimates program is not only contributing to the estimates but a deeper understanding of them so that we can provide information to local, public and private data users about how the estimates are produced,” said Jeff Hardcastle, Nevada state demographer and FSCPE steering committee chair.
The FSCPE is also active in a number of ways that support the decennial census. For example, they are participants in the Local Update of Census Addresses as well as the Count Review program, a major initiative every decade to enhance the accuracy of the decennial census.
The partnership between the Census Bureau and the states through the FSCPE ensures the highest quality estimates. The FSCPE program, established in 1967, consists of 56 members that represent each state, the District of Columbia, Puerto Rico and the four U.S. Island Areas. See FSCPE to find out more about this key partnership and contacts in your state. Click on Census Information Centers and State Data Centers for other key contacts and partnership programs.
Recent Data Releases
December 2017 Releases
High School Completion Rate Is Highest in U.S. History- For the first time in U.S. history, 90 percent of the population age 25 and older have completed high school. This is according to new Educational Attainment data released today from the U.S. Census Bureau. “In 1940, less than half of the population age 25 and older had a high school diploma. Over the years this has increased to the point where we now have 90 percent who have completed high school,” said Kurt Bauman, a demographer in the Social, Economic, and Housing Statistics division. “That means out of the 217 million people age 25 and older, 194 million have a high school diploma or higher” https://www.census.gov/newsroom/press-releases/2017/educational-attainment-2017.html (December 14).
2016 Annual Survey of Manufactures: General Statistics, Value of Products Shipments, Industry-Product Analysis and Geographic Area Statistics- The 2016 Annual Survey of Manufactures (ASM) release includes general statistics, value of products shipments, industry-product analysis and geographic area statistics for 2015 and 2016. The ASM provides data about manufacturing that are crucial to accurate estimates of domestic production and productivity and to making sound decisions on economic trade policies. Companies, business analysts and trade associations use this data in planning investments, production and marketing https://www.census.gov/newsroom/press-releases/2017/cb17-tps86.html (December 15).
2017 Census of Governments Underway- The third and final phase of the 2017 Census of Governments began Nov. 6, 2017, and will continue through Sept. 28, 2018. The Local Finance component of this survey provides the only source of nationwide, comprehensive information on state and local government finances. This phase collects statistics on revenue, expenditure, debt and assets (cash and security holdings) for U.S. governments, and measures federal, state and local fiscal relationships. State and Local Finance statistics for 2015 are currently available for the 50 state areas and the District of Columbia, as well as a national summary https://www.census.gov/newsroom/press-releases/2017/cog.html (December 19).
Idaho is Nation’s Fastest-Growing State, Census Bureau Reports- Idaho was the nation’s fastest-growing state over the last year. Its population increased 2.2 percent to 1.7 million from July 1, 2016, to July 1, 2017, according to the U.S. Census Bureau’s national and state population estimates released December 20, 2017 https://www.census.gov/newsroom/press-releases/2017/estimates-idaho.html (December 20).
Page Last Revised - October 8, 2021
✕
Is this page helpful?
 Yes
Yes
 No
No
 Yes
Yes
 No
No✕
NO THANKS
255 characters maximum
 255 characters maximum reached
✕
Thank you for your feedback.
Comments or suggestions?

Comments or suggestions?