BDS-Single Unit Firms Methodology
BDS-Single Unit Firms Methodology
The BDS-SU-REV product follows the BDS methodology. Payroll creation and destruction are defined analogously to job creation and destruction, namely:
- Payroll Creation (PayC) – Payroll creation is the sum of all payroll gains from payroll-expanding firms from year t–1, quarter n to year t, quarter n including firm startups.
- Payroll Destruction (PayD) – Payroll destruction is the sum of all payroll losses from payroll-contracting firm (pleases from year t–1, quarter n to year t, quarter n including firms shutting down.
More precisely, definitions of pay creation, destruction, net change, and net change rate for firms classified in groups are given by:
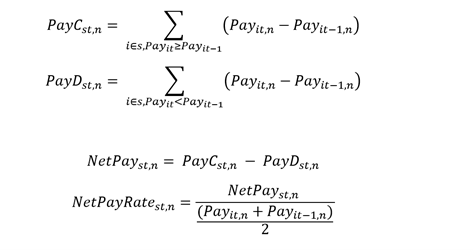
Total revenue, revenue creation, and revenue destruction are defined the following way:
- Revenue in quarter n year t (Rev) – Annual Revenue (in thousands of dollars) at single-establishment firms with positive employment in quarter n in year t (active in quarter n in year t). Note that revenue is an annual measure while active status is defined at the quarterly level.
- Revenue Creation in quarter n year t (RevC) – Revenue creation is the sum of all revenue gains from revenue-expanding firms from year t–1 to year t including firm startups.
- Revenue Destruction in quarter n year t (RevD) – Revenue destruction is the sum of all revenue losses from revenue-contracting firms from year t–1 to year t including firm closures.
Time Frame and Single-Unit Firm Universe
The BDS-SU-REV product is available from 2007-2022, which is a substantially shorter time frame than the main BDS. The quarterly IRS employment variables were first collected in 2004 and but the data were not of high enough quality to use for publication until 2005. Our data cleaning algorithm uses year t-2 data to edit year t-1 and year t-1 to edit year t data, resulting in a clean pair of t and t-1 employment and payroll values for each year in the time series. For this reason, we begin our time series with the 2006-2007 year comparison, using 2005 as the baseline year for editing 2006 data (see Redesigning the Longitudinal Business Database (census.gov), page 45).
For revenue, high quality data to use for publication have only been created for 2017-2022 and hence the revenue columns are only populated beginning with the 2017-2018 comparison. Work is on-going to produce revenue for earlier years and extend the BDS-SU-REV time series backwards in time.
The BDS-SU-REV universe is defined as all the firms that the Census Business Register has determined to be operating in a single physical location during a given year. The main reason to exclude multi-unit firms is that payroll and employment are reported to the IRS at an aggregate level for these types of firms. The Census Bureau models the allocation of firm payroll and employment to individual establishments within a multi-unit firm for quarter 1 of each year but does not allocate additional quarters. In addition, the scope of the single-unit population is honed to the same industry and geography requirements as the main BDS (see Redesigning the Longitudinal Business Database (census.gov), page 46).
Transitions in Single-unit Status
Each year some firms transition from having multiple establishments to having only one and vice versa. The multi-unit to single-unit transitions (MU-SU) in year t create a set of firms that belong to the single-unit universe, but which don’t have clearly defined employment and payroll flows beyond quarter 1. Establishments that belong to multi-unit firms in year t-1 don’t have quarter 2 – 4 employment and payroll for year t-1 and hence we cannot measure job creation and destruction between year t-1 and t in any quarter except quarter 1. Thus, for these cases, we set all employment flows to zero and simply include the relevant employment in total employment for the year. This assumption treats MU-SU transitions as if they had experienced constant employment across the two years. By definition, they are continuers, having operated in year t-1 and year t, and are not counted as entrants.
If a single-unit firm grows and opens additional establishments, i.e., new locations, it becomes a multi-unit (SU-MU transition). This type of change will remove the firm from the single-unit universe, beginning with the SU-MU transition year, and drop the associated employment from the totals. We do not count any employment flows from this type of transition, nor do we label the firm as an exit.
In the main BDS, the year t establishment count is equal to the year t-1 count plus entrants and minus exits plus the net effect of any scope changes that move establishments in and out of the BDS universe. The same is true to an even larger extent in the BDS-SU-REV tables because of transitions in and out of multi-unit status. Abstracting away from other scope changes, in the BDS-SU, the year t, quarter n establishment count is equal to the year t-1, quarter n count plus entrants, minus exits, plus MU-SU transitions, and minus SU-MU transitions. These transitions happen most often in Economic Census years or in the year immediately after an Economic Census. They represent a small percentage of establishments in each year (.1% on average) but sometimes have out-sized effects on more granular cells. In particular, there are occasions where a few large transitions cause relatively large changes in employment without corresponding job creation or destruction. This happens because employment moves in or out of the single-unit universe without being counted as an entrant or exit, as explained above. Research in on-going about how to improve measurement of the timing of these transitions, as well as how to account for the employment flows.
Relationship Between Entrants, Exits, Firm Age, and Number of Prior Active Quarters
Both the main BDS and the BDS single-units rely on year-over-year changes. This approach minimizes the effect of seasonality, or patterns in the data that occur every year due to weather, holiday timing, or other factors that affect the operation of certain types of businesses. By comparing year t data to the same point in year t-1, we measure employment changes due to underlying economic factors instead of changes from one season to the next. However, this method means that a firm entry or exit will generally be counted as such for multiple quarters. For example, if a firm operated continuously until quarter 2 of year t, it will be defined as an exit because it was still in operation in quarter 2 of year t-1. If it remains closed in quarter 3 of year t, it will again be classified as an exit because it was in operation in quarter 3 of year t-1. The same is true for births. Thus, when reporting all the entrants and exits for a quarter, there is some ambiguity about how many of them, in fact, first happened in that quarter.
For births, this problem is solved by using quarterly firm age. Age zero entrants in any quarter are “true” births, i.e., opening firms that have never operated before. Entrants between ages one and three in any quarter are firms operating for the first time in that quarter that initially opened in one of the prior three quarters. To mimic this concept for firm exit, we created a count of active quarters in the immediately preceding three quarters. In their first quarter with no payroll or employment, exiting firms will be categorized as having three prior active quarters. In the second quarter after cessation of activity, the exit will have only two prior active quarters, and so on until the fourth quarter when they will have zero prior active quarters. We use the number of prior active quarters as a by-variable in a one-way table to show the precise timing of exits.
Some businesses may close for one or two quarters and then re-open. This may happen for seasonal reasons (winter or summer recreation activities, specialty holiday retail, etc.) but also due to temporary economic shocks. The number of prior active quarters helps to trace out the pattern of exit and reactivation. The number of exits in quarter n with only two prior active quarters (i.e., not a first-time exit) is lower than the number of exits in quarter n-1 with three prior active quarters (i.e., first-time exits) and the difference is due to reactivations, in this case firms that closed for a single quarter and then re-opened. Large jumps relative to the historical time trend of exits with three prior active quarters followed by a return to more normal levels of exits with two prior active quarters in the subsequent quarter can signify a temporary economic disruption followed by a recovery as some businesses re-open.
Payroll and Revenue Deflation
As in any monetary time series, it is important to account for inflation when comparing values over time. The BDS-SU-REV tables include both nominal and real payroll versions. Real payroll is calculated using the GDP Price Deflator from the Bureau of Economic Analysis (BEA). We use the formula: real payroll = current year payroll * (100/GDP deflator) and maintain the Metro/Non-Metro base year of 2017.
Questions? Contact us at [email protected].
