For Immediate Release: Thursday, May 24, 2018
Census Bureau Reveals Fastest-Growing Large Cities
San Antonio Tops Chart Adding More Than 60 People a Day on Average
May 24, 2018 — Eight of the 15 cities or towns with the largest population gains were located in the South in 2017, with three of the top five in Texas, according to new population estimates released today by the U.S. Census Bureau.
“San Antonio, Texas, tops the list with the largest population gain with an increase of over 24,200 people – an average of 66 people per day between 2016 and 2017,” said Amel Toukabri, a demographer in the Population Division of the Census Bureau. “That’s a growth rate of 1.6 percent. This growth was enough to push San Antonio's population above the 1.5 million mark.”
Some of the other cities with the largest population gains were Phoenix, Ariz. (24,000); Dallas, Texas (18,900); Fort Worth, Texas (18,700); Los Angeles, Calif. (18,600); Seattle, Washington (17,500); and Charlotte, N.C. (15,600).
Regarding percentage change in population, 10 of the 15 fastest-growing large cities were located in the South, with seven in Texas. Between 2016 and 2017, Frisco, Texas (near Dallas), was the fastest-growing large city (population of 50,000 or more) at 8.2 percent, making its growth rate more than 11 times faster than the nation’s growth rate of 0.7 percent. See below for some of the other fastest-growing large cities.
Fort Worth, Texas, Surpasses Indianapolis to Become the 15th Most Populous U.S. City
Fort Worth, Texas, surpassed Indianapolis, Ind., becoming the 15th largest city in the United States with a population of 874,168. Indianapolis has a population of 863,002. The 14 largest U.S.cities have not changed since 2016.
Small Town America
While the main focus of this release has been on the 3.9 percent of cities with populations of 50,000 or more, the United States is a nation of small towns. Of the nation’s 325.7 million people, an estimated 205.0 million (62.9 percent) live within an incorporated place as of July 1, 2017. Of approximately 19,500 incorporated places, about 76 percent had fewer than 5,000 people and nearly 50 percent had fewer than 1,000 people.
Regional Growth
The West had the highest share of its population living within an incorporated place (76.7 percent), followed by the Midwest (71.4 percent) as of July 1, 2017. The Northeast had the smallest population of its residents living in incorporated places (51.4 percent).
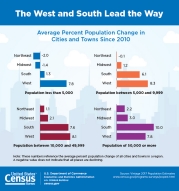
The South had the most city dwellers of any region at 67.9 million. However, this accounted for only 54.9 percent of the South’s 123.7 million total population. Since the 2010 Census, large cities in the South and West have led the nation in population growth, with an average increase of 10.0 percent (16,206) and 7.8 percent (12,256), respectively. By comparison, those in the Northeast and Midwest grew on average by 2.2 percent (9,104) and 3.0 percent (3,942), respectively.
After a Decade, Housing Unit Growth Remains Below 2007 Levels in Nearly All States
The nation’s housing stock grew by more than 1 million last year, reaching over 137 million units. The growth rate of 0.8 percent from 2016 to 2017 was slower than the 1.4 percent a decade ago between 2006 and 2007.
Housing unit growth last year remained below 2007 levels in nearly all states except North Dakota (up 1.0 percent last year, compared to a 0.9 percent increase in 2007); the District of Columbia (up 1.1 percent, compared to a 0.9 percent increase in 2007); South Dakota (up 1.4 percent, compared to a 1.2 percent increase in 2007); Iowa (up 0.9 percent, compared to a 0.7 percent increase in 2007); and Nebraska (returned to the 2007 growth rate of 0.8 percent).
Between July 1, 2016, and July 1, 2017, Utah was the fastest-growing state in terms of housing units, with an increase of 2.1 percent. Idaho and Colorado were the second- and third-fastest growing states with increases of 1.7 percent and 1.6 percent, respectively. West Virginia and Rhode Island were tied as the slowest-growing states with increases of 0.2 percent.
Housing Unit Growth Since Census Day (April 1, 2010)
The nation’s housing stock increased by 5.7 million units (4.3 percent) since April 1, 2010. North Dakota was the fastest-growing state in terms of housing units, with an increase of 18.0 percent during the same period. Rounding out the top five states in percent gain were Utah (10.7 percent), Texas (9.6 percent), Idaho (8.1 percent) and South Dakota (8.0 percent).
Fourteen states added more than 100,000 housing units between April 1, 2010, and July 1, 2017. In terms of the largest numeric increase, the top five were Texas (955,000), California (497,000), Florida (452,000), North Carolina (295,000) and New York (219,000).
Several maps are available with additional data for housing unit change by county: Difference in Housing Unit Change by County and Percentage Change in Housing Units by County.
The statistics released today cover all local functioning governmental units, including incorporated places (like cities and towns), minor civil divisions (such as townships), and consolidated cities (government units for which the functions of an incorporated place and its parent county have merged).
In June 2018, the Census Bureau will release 2017 population estimates by age, sex, race and Hispanic origin for the nation, states and counties. The data will be embargoed June 19 and publicly released June 21.
Find more highlights from this year's release and local-level statistics on census.gov. Tag @uscensusbureau in stories and email [email protected] to interview a subject expert.
| Rank | Area name | State | Numeric increase | 2017 total population |
|---|---|---|---|---|
| 1 | San Antonio city | Texas | 24,208 | 1,511,946 |
| 2 | Phoenix city | Arizona | 24,036 | 1,626,078 |
| 3 | Dallas city | Texas | 18,935 | 1,341,075 |
| 4 | Fort Worth city | Texas | 18,664 | 874,168 |
| 5 | Los Angeles city | California | 18,643 | 3,999,759 |
| 6 | Seattle city | Washington | 17,490 | 724,745 |
| 7 | Charlotte city | North Carolina | 15,551 | 859,035 |
| 8 | Columbus city | Ohio | 15,429 | 879,170 |
| 9 | Frisco city | Texas | 13,470 | 177,286 |
| 10 | Atlanta city | Georgia | 13,323 | 486,290 |
| 11 | San Diego city | California | 12,834 | 1,419,516 |
| 12 | Austin city | Texas | 12,515 | 950,715 |
| 13 | Jacksonville city | Florida | 11,169 | 892,062 |
| 14 | Irvine city | California | 11,068 | 277,453 |
| 15 | Henderson city | Nevada | 10,534 | 302,539 |
| Rank | Area name | State |
Percent increase |
2017 total population |
|---|---|---|---|---|
| 1 | Frisco city | Texas | 8.2 | 177,286 |
| 2 | New Braunfels city | Texas | 8.0 | 79,152 |
| 3 | Pflugerville city | Texas | 6.5 | 63,359 |
| 4 | Ankeny city | Iowa | 6.4 | 62,416 |
| 5 | Buckeye city | Arizona | 5.9 | 68,453 |
| 6 | Georgetown city | Texas | 5.4 | 70,685 |
| 7 | Castle Rock town | Colorado | 5.1 | 62,276 |
| 8 | Franklin city | Tennessee | 4.9 | 78,321 |
| 9 | McKinney city | Texas | 4.8 | 181,330 |
| 10 | Meridian city | Idaho | 4.7 | 99,926 |
| 11 | Flower Mound town | Texas | 4.3 | 76,681 |
| 12 | Bend city | Oregon | 4.3 | 94,520 |
| 13 | Cedar Park city | Texas | 4.2 | 75,704 |
| 14 | Doral city | Florida | 4.2 | 61,130 |
| 15 | Fort Myers city | Florida | 4.2 | 79,943 |
| Rank | Area Name | State | 2017 total population |
|---|---|---|---|
| 1 | New York city | New York | 8,622,698 |
| 2 | Los Angeles city | California | 3,999,759 |
| 3 | Chicago city | Illinois | 2,716,450 |
| 4 | Houston city | Texas | 2,312,717 |
| 5 | Phoenix city | Arizona | 1,626,078 |
| 6 | Philadelphia city | Pennsylvania | 1,580,863 |
| 7 | San Antonio city | Texas | 1,511,946 |
| 8 | San Diego city | California | 1,419,516 |
| 9 | Dallas city | Texas | 1,341,075 |
| 10 | San Jose city | California | 1,035,317 |
| 11 | Austin city | Texas | 950,715 |
| 12 | Jacksonville city | Florida | 892,062 |
| 13 | San Francisco city | California | 884,363 |
| 14 | Columbus city | Ohio | 879,170 |
| 15 | Fort Worth city | Texas | 874,168 |
| Population Less Than 5,000 as of 2016 | |||
|---|---|---|---|
| Region | Number of areas | Average numeric change | Average percent change |
| Northeast | 1,439 | -3 | -0.2 |
| Midwest | 7,016 | 0 | -0.1 |
| South | 4,987 | 5 | 0.2 |
| West | 1,340 | 13 | 0.9 |
| Population of 5,000 to 9,999 as of 2016 | |||
| Region | Number of areas | Average numeric change | Average percent change |
| Northeast | 297 | 1 | 0.0 |
| Midwest | 541 | 29 | 0.4 |
| South | 583 | 66 | 0.9 |
| West | 248 | 111 | 1.5 |
| Population of 10,000 to 49,999 as of 2016 | |||
| Region | Number of areas | Average numeric change | Average percent change |
| Northeast | 297 | 34 | 0.1 |
| Midwest | 782 | 55 | 0.3 |
| South | 773 | 256 | 1.1 |
| West | 439 | 278 | 1.2 |
| Population of 50,000 or More as of 2016 | |||
| Region | Number of areas | Average numeric change | Average percent change |
| Northeast | 78 | 395 | 0.2 |
| Midwest | 158 | 486 | 0.4 |
| South | 235 | 1,746 | 1.2 |
| West | 287 | 1,482 | 1.0 |
###
Contact
Amy Newcomb
Public Information Office
301-763-3030
[email protected]
Related Information

