Anniversary of Americans With Disabilities Act: July 26, 2022
On July 26, 1990, then-President George H.W. Bush signed into law the Americans With Disabilities Act, which prohibits discrimination against people with disabilities in employment, transportation, public accommodations, commercial facilities, telecommunications and state and local government services.
This Facts for Features provides a demographic snapshot of the U.S. population with a disability and examines various services available to it. The statistics come from various U.S. Census Bureau censuses and surveys covering different periods of time.
The following facts are possible thanks to responses to the Census Bureau’s surveys. We appreciate the public’s cooperation as we continuously measure America’s people, places and economy.
Did You Know?
40.8 million or 12.7%
The total U.S. civilian noninstitutionalized population with a disability during the five-year period from 2016-2020.
Source:
19.3%
The percentage of West Virginia’s civilian noninstitutionalized population with a disability during the five-year period from 2016-2020, the highest share of any state in the nation. Utah, at 9.7%, had the lowest share.
Source:
7.7 million
The total U.S. civilian noninstitutionalized population ages 18 to 64 with a disability employed from 2016-2020.
Source:
$25,162
Median earnings (in 2020 inflation-adjusted dollars) of the U.S. civilian noninstitutionalized population ages 16 and over with a disability during the previous 12 months from 2016-2020.
Source:
More on Disability
More Stats
A detailed profile of the U.S. population with a disability is available from the 2016-2020 American Community Survey 5-year estimates. Statistics include:
- Sex.
- Race.
- Age.
- Hearing difficulty by age.
- Vision difficulty by age.
- Cognitive difficulty by age.
- Ambulatory difficulty by age.
- Self-care difficulty by age.
- Independent living difficulty by age.
Related News Products
Past Facts for Features
- Facts for Features: Anniversary of Americans With Disabilities Act: July 26, 2021
- Facts for Features: Anniversary of Americans With Disabilities Act: July 26, 2020
- Facts for Features: Anniversary of Americans With Disabilities Act: July 26, 2019
- Facts for Features: Anniversary of Americans With Disabilities Act: July 26, 2018
- Facts for Features: Anniversary of Americans With Disabilities Act: July 26, 2017
Blogs
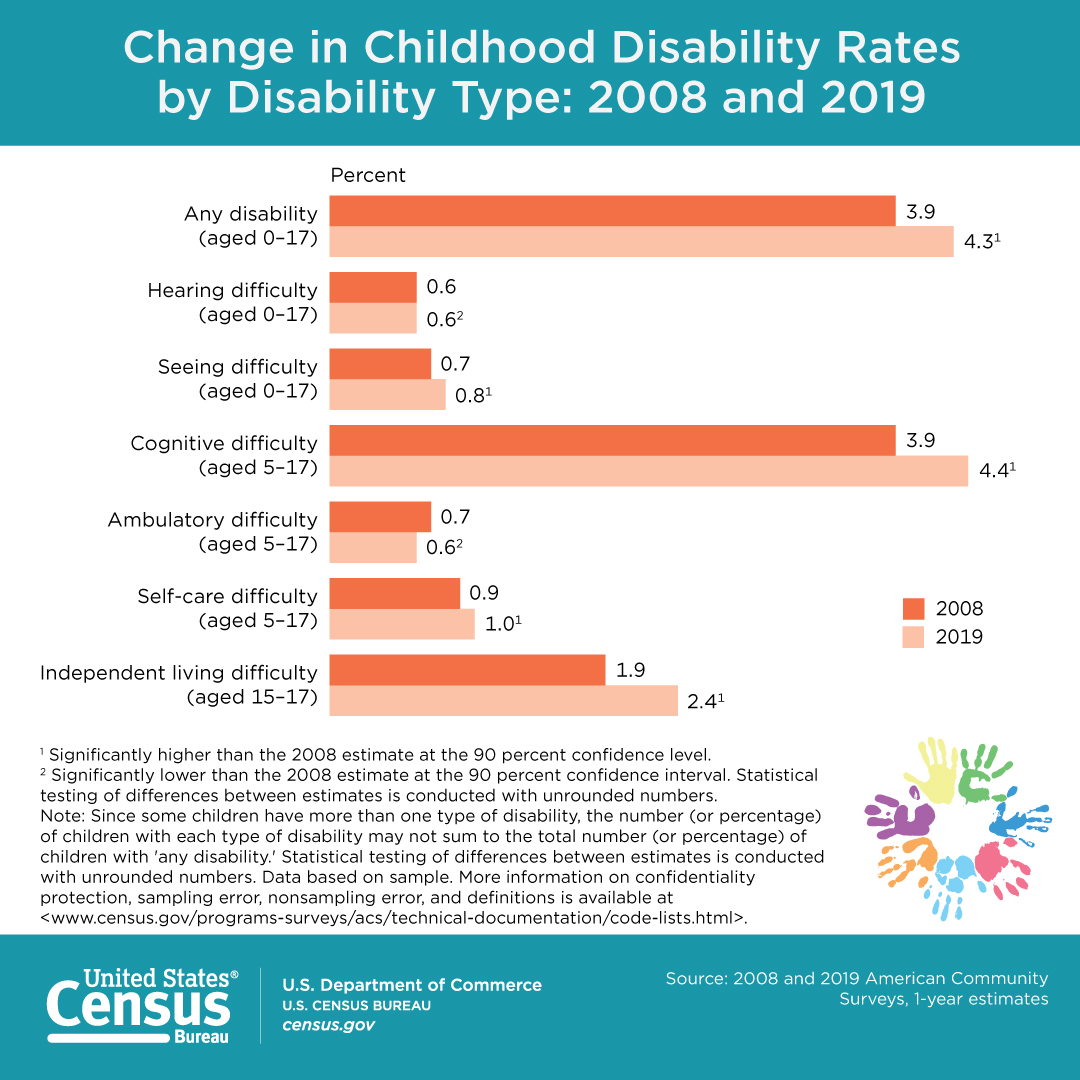
- U.S. Childhood Disability Rate Up in 2019 From 2008
- Do People With Disabilities Earn Equal Pay?
- The Occupations of Workers with Disabilities
- The Age and Disability Paradox
Graphics
Related Information
The following is a list of observances typically covered by the Census Bureau’s Facts for Features series:
Black (African American) History Month (February)
Women's History Month (March)
Irish-American Heritage Month (March)
Asian/Pacific American Heritage Month (May)
The Fourth of July (July 4)
Anniversary of Americans With Disabilities Act (July 26)
Hispanic Heritage Month (Sept. 15-Oct. 15)
Halloween (Oct. 31)
American Indian/Alaska Native Heritage Month (November)
Veterans Day (Nov. 11)
Thanksgiving Day/Holiday Season (November-December)
Editor’s note: The preceding data were collected from a variety of sources and may be subject to sampling variability and other sources of error. Facts for Features are customarily released about two months before an observance in order to accommodate magazine production timelines. Questions or comments should be directed to the Census Bureau’s Public Information Office: telephone: 301-763-3030; or e-mail: pio@census.gov.
Profile America's Facts for Features provides statistics related to observances and holidays not covered by Stats for Stories. For observances not listed below, visit our Stats for Stories web page.
Profile America's Stats for Stories provides links to timely story ideas highlighting the Census Bureau's newsworthy statistics that relate to current events, observances, holidays, and anniversaries. The story ideas are intended to assist the media in story mining and producing content for their respective audiences.


