
Official websites use .gov
A .gov website belongs to an official government organization in the United States.
Secure .gov websites use HTTPS
A lock (
) or https:// means you’ve safely connected to the .gov website. Share sensitive information only on official, secure websites.

Topics
Data & Maps
Surveys & Programs
Resource Library
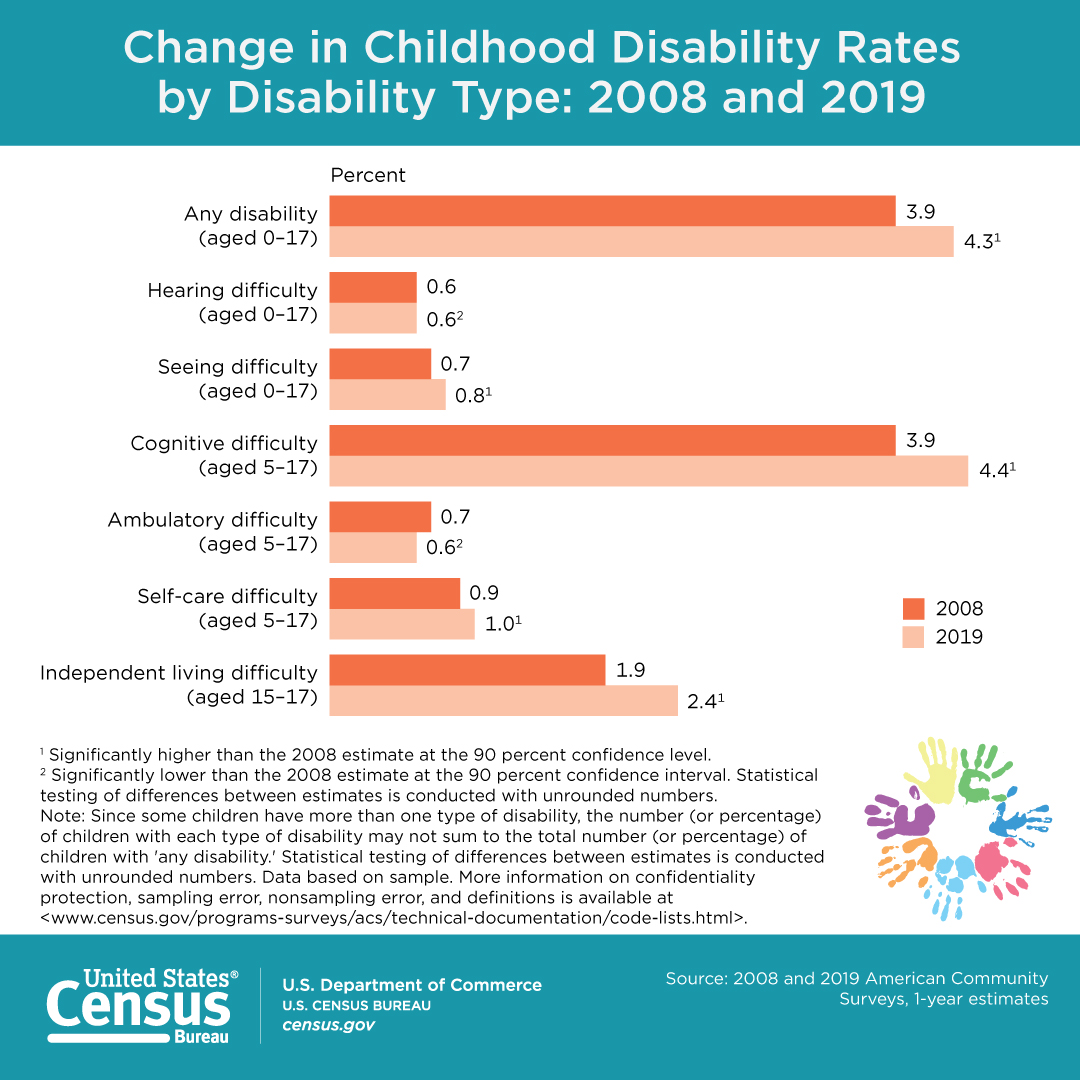
Change in Childhood Disability Rates by Disability Type: 2008 and 2019
Change in Childhood Disability Rates by Disability Type: 2008 and 2019

Download or Print this Infographic

Sources and Reference
Note: Since some children have more than one type of disability, the number (or percentage) of children with each type of disability may not sum to the total number (or percentage) of children with 'any disability.' Statistical testing of differences between estimates is conducted with unrounded numbers. Data based on sample. More information on confidentiality protection, sampling error, nonsampling error, and definitions is available at <www.census.gov/programs-surveys/acs/technical-documentation/code-lists.html>.
Source: 2008 and 2019 American Community Surveys, 1-year estimates
Page Last Revised - July 11, 2022
✕
Is this page helpful?
 Yes
Yes
 No
No
 Yes
Yes
 No
No✕
NO THANKS
255 characters maximum
 255 characters maximum reached
✕
Thank you for your feedback.
Comments or suggestions?

Comments or suggestions?