Census Bureau Reports State Government Tax Collections Reach High of Nearly $800 Billion in Fiscal Year 2012
For Immediate Release: Thursday, April 11, 2013
Census Bureau Reports State Government Tax Collections Reach High of Nearly $800 Billion in Fiscal Year 2012
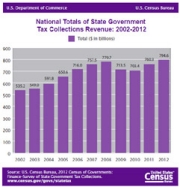
Overall state government tax collections increased $34.3 billion from fiscal year 2011 to a record $794.6 billion in 2012, the U.S. Census Bureau reported today. The previous high for overall state tax collections was $779.7 billion in 2008. State tax revenue is up 13.0 percent from $703.4 billion in 2010, which was the lowest collected total since 2005. (State tax figures are represented as current whole dollars and are not adjusted for inflation.).
Overall state tax revenue on individual income was at $280.4 billion for 2012, up 8.1 percent from 2011, while general sales tax revenue was at $242.7 billion for 2012, up 2.9 percent from 2011. License tax revenue increased to $54.0 billion for 2012, up 4.7 percent from 2011. Individual income tax revenue, general sales tax revenue and license tax revenue comprised 72.6 percent of all state government tax collections nationally.
"These findings are the first to be released from the 2012 Census of Governments and provide an indicator of the fiscal health of our state governments and their ability to provide public services," said Lisa Blumerman, chief of the Census Bureau's Governments Division. (Figure 1)
These new statistics come from the 2012 Annual Survey of State Government Tax Collections, which contains annual statistics on the fiscal year tax collections of all 50 state governments, including receipts from compulsory fees. This survey provides an annual summary of taxes collected by states which fall broadly into categories such as property taxes, sales and gross receipts taxes, license taxes and income taxes. Statistics are further broken down into 25 subcategories which cover collection on items such as motor fuel taxes, severance taxes and hunting license taxes. Tax revenues also include related penalty and interest receipts of the governments.
"The Census Bureau's state government tax collections data are an essential benchmark of state fiscal conditions," said Donald Boyd, a senior fellow at the Nelson A. Rockefeller Institute of Government at the State University of New York in Albany. "The latest data show that state tax revenue is continuing to recover, albeit slowly, from the depth of the recession."
Forty-seven states saw an increase in total tax revenue in fiscal year 2012, led by North Dakota (47.0 percent), Alaska (27.3 percent), Illinois (19.1 percent) and Connecticut (15.0 percent).
Among some of the findings from selected tax subcategories:
- States with the largest percentage increase in revenue from individual income taxes were Illinois (39.8 percent), Hawaii (23.5 percent), Oklahoma (16.3 percent) and Connecticut (13.9 percent).
- States with the largest percentage increase in motor fuels tax revenue were Oregon (20.7 percent), North Dakota (19.7 percent), Arizona (15.8 percent) and North Carolina (12.0 percent).
- Severance taxes — collected for removal or harvesting of natural resources (e.g., oil, gas, coal, timber, fish, etc.) — were up $4.2 billion in 2012, a 29.0 percent increase from 2011. This followed a 29.8 percent increase from 2010 to 2011. The largest increases in severance tax revenue were in the West and Midwest.
- Motor vehicle license tax revenue increased $1.1 billion in 2012, a 4.9 percent increase from 2011. This followed a 4.0 percent increase from 2010 to 2011. Motor vehicle license taxes are imposed on owners or operators of motor vehicles, commercial and noncommercial, for the right to use public highways, including charges for title registration and inspection of vehicles.
These statistics do not include employer and employee assessments for retirement and social insurance purposes. Also excluded are collections for the unemployment compensation taxes imposed by each of the state governments. These statistics include tax collections for state governments only; they do not include tax collections from local governments.
Visit the state tax main page for more information.
-X-
Although the data are not subject to sampling error, the statistics are subject to possible inaccuracies in classification, response and processing. Every effort is made to keep such errors to a minimum through care in examining, editing and tabulating the data.
The tax revenue data pertain to state fiscal years that ended June 30, 2012, in all but four states. Amounts shown for these four states reflect the different timing of their respective fiscal years, which were the 12-month periods ending on March 31, 2012 for New York; Aug. 31, 2012 for Texas; and Sept. 30, 2012 for Alabama and Michigan.


