
end of header
Exports from Manufacturing Establishments
You are here: Census.gov › Business & Industry › Manufacturing › Exports from Manufacturing Establishments › How the Data are Collected
How the Data are Collected
General Methodology
The estimates in this report rely upon 3 major information sources: (1) the U.S. Census Bureau’s Annual Survey of Manufactures; (2) detailed data from the Census Bureau’s U.S. International Trade in Goods and Services; and (3) the Bureau of Economic Analysis’ Input-Output (I/O) Accounts of the U.S. Economy. To provide a means for using these different sources on a comparable basis required manipulations and conversions. For example, each of these sources uses a different classification scheme (NAICS for the economic census, manufacturing sector, the Harmonized System for the exports of merchandise, and a NAICS based system for I/O accounts). The user should bear in mind that conversions and adjustments for such differences are imperfect, and a potential source of error in the figures presented in this report. These estimates are preliminary because I/O data are not available when the estimates are calculated. Final estimates of export-related employment will incorporate I/O data.
A short description of the methodology is as follows: Exports as reported by manufacturers on the Annual Survey of Manufactures (ASM) were allocated to the industry and state of that manufacturer. These export totals then were compared to the U.S. International Trade in Goods and Services, as reported by exporting firms. Because many manufacturers do not know whether or not their products are exported, the export data from the ASM were adjusted to the totals from the U.S. International Trade in Goods and Services, with differences allocated to industries and states. These data then represented the "direct" exports of manufactured goods, by industry and by state.
Employment-to-shipment ratios from the ASM were used to estimate employment for each state-industry combination, resulting in employment attributable to direct exports.
Deriving supporting shipments required use of regional multipliers based on I/O Accounts. These multipliers provide a means to estimate resources needed to produce a unit of output. Using the direct exports estimated above and shipments -multipliers yields estimates of the supporting shipments associated with direct exports. Again, employment-to-shipment ratios were used to compute supporting employment for the manufacturing industries. Employment-multipliers were used to estimate supporting employment for nonmanufacturing industries.
Relationship to Census Bureau's Series on Origin of Movement of U.S. Exports by State
Each month the Census Bureau issues a report on the Origin of Movement of U.S. Exports of Goods by State. The data in this series include both manufactured and nonmanufactured products exports. Data are shown for the state where the merchandise began its export journey as reported by the exporter on the export declaration document filed with the U.S. Department of Commerce at the port of export. This series provides data based on the “origin” of the commodity movement into international trade. That “origin” may be the location of the manufacturer, a warehouse, an intermediary who has arranged the sale, an assembly or packaging point, or the port of export. Thus the origin of movement data differ from the estimates in this publication, which solely reflect the physical location of the manufacturer.
Historical Information
This report began in 1960 and measured initially only direct exports and direct export-related employment. In 1976, the program was expanded to encompass analytically-derived estimates for supporting exports and related employment. Users should bear in mind, though, that methodological changes can affect the comparability of these data when making year-to-year comparisons. This is particularly true with respect to these preliminary estimates for 2005 forward and how they relate to previously published years.
Detailed Description of Census Methods for Preliminary Estimating Procedures
The sections that follow describe the methodology used to develop estimates of the employment effects of manufactured exports at the national level and by state.
Derivation of Direct Export-Related Employment
Manufacturers reporting in the Annual Survey of Manufactures were requested to:
-
Report the value of products shipped for exports. Include direct
exports and products shipped to exporters or other wholesalers for
export. Also include the value of products sold to the U.S. Government
to be shipped to foreign governments. Do not include products shipped
for further manufacture, assembly, or fabrication in the United
States.
Such directly reported exports understate the true value of all exports because many respondents do not know the final destination of the products produced in their plants. This includes cases where the export transaction is actually arranged by an independent exporting firm (e.g., a wholesaler) or where shipments of the products are made from company-operated warehouses or other distribution points which do not allocate or report the export sales back to individual producing establishments.
Estimated value of exports
In order to provide a more accurate measure of the overall importance of exports industrially and geographically, directly reported values from the ASM have been adjusted to include estimates for the unreported exports, including exports of manufactured products by wholesalers, retailers, etc.
The values for total U.S. exports of manufactured products are from official export data compiled by the Foreign Trade Division of the Census Bureau based on Shippers’ Export Declarations. Re-exports are excluded from the figures because only domestically manufactured exports are relevant to estimation of export-related employment.
Merchandise exports were collected and compiled in accordance with the commodity classifications in Schedule B, Statistical Classification of Domestic and Foreign Commodities Exported From the United States. These classifications were rearranged into an export product nomenclature related to the origin of production called the North American Industry Classification System (NAICS). Export data for Puerto Rico and the U.S. Virgin Islands were subtracted from the file. This was done because these areas are not included in the ASM; hence, their removal from the data was necessary to accurately estimate the effects of exports on the domestic economy. By the same token, exports from the United States to these territories were added to the merchandise export data. These adjustments were performed by the Foreign Trade Division.
Merchandise export data are collected on an individual commodity transaction basis, while export data in the ASM are collected on the basis of all commodities exported by the industry. To put the two sets of data on the same basis, the merchandise export data from the Foreign Trade Division were converted to an industry basis using the Annual Survey of Manufactures data on the distribution of product shipments by industry.
Export data from the Census Bureau’s Foreign Trade Division are collected at the port of export on a free alongside ship (f.a.s.) basis, and thus include freight and wholesale margins. To make the export data comparable with data collected in the ASM, the margins were subtracted to derive a freight on board (f.o.b.) plant value. The Bureau of Economic Analysis’ Input/Output (I/O) commodity margin rates from the I/O tables were converted to industry margin rates and then applied to the merchandise exports on an industry basis to derive the f.o.b. plant value of exports by industry.
Survey-based estimates of direct exports at the industry x state level were derived by adjusting the directly reported exports data from the Annual Survey of Manufactures for nonresponse, and undercoverage.
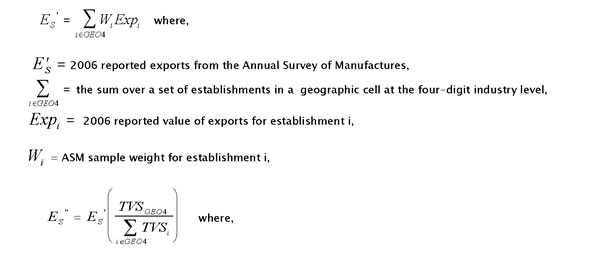
Next, differences between the national totals of export shipments obtained from the Foreign Trade Division’s data and national totals of survey-based estimates were allocated to the individual states. At the state level, the differences were added to the survey-based estimates to arrive at state-by-state estimates of the total f.o.b. value of exports by manufacturing establishments. Details of the allocation and estimation methods are provided below.
Allocation of unreported value of exports
Differences between the national totals of survey-based estimates and the national export estimates f.o.b. plant were allocated to states on a detailed NAICS level. The estimating procedure assumes that export shipments not reported by manufacturing establishments are directly related to the geographic distribution of the total value of shipments of the industry and export shipments as reported for each state on the ASM.
This results in the proportion of the total value of industry shipments accounted for by this state being weighted more heavily when the difference between the survey-based estimate and the national export estimate increases. When the difference between survey-based and national estimates decreases (or vanishes), the proportion of survey-based exports accounted for by the state is weighted more heavily. There are no measures available regarding the possible range of error associated with this estimating technique.
Estimating direct export-related employment
Employment related to direct exports is not collected in the ASM. However, the total value of shipments, as well as total employment, are estimated for each industry in each state. Using these data from the ASM, employment related to direct exports was calculated by multiplying the total employment of each industry in each state by the ratio of the estimated total f.o.b. value of exports for that industry in that state to total shipments for that industry in that state. As with the estimates of exports, there are no measures available regarding the possible range of error associated with this estimating technique.
Supporting Shipments for Manufactured Exports
The previous section described how estimates of the f.o.b. plant value of exported manufactured goods were made, were converted to numbers of employees, and how both the value and employment were allocated by state. This section describes how the indirect inputs to these exports were estimated and allocated by state.
Definition of supporting shipments
Supporting shipments refer to all of the inputs purchased by the manufacturing establishments to produce the product being exported and the inputs purchased by these suppliers, etc. As an example, the export value of chemicals in 2006 amounted to $103.2 billion as goods left the manufacturing plant. To produce the $103.2 billion of chemicals, it was necessary for these plants to purchase petroleum and coal products from other plants, various other materials, containers for shipping, electrical energy from utility firms, oil and lubricants for maintenance, a variety of business and professional services, etc.
Producers of the various inputs and services which were sold to chemical producers also had to purchase inputs and various services from farms, mines, factories, utilities, transportation firms, etc. These secondary suppliers, in turn, had to purchase inputs from their suppliers. At the aggregate level, this lengthy chain of transactions leading to the production of chemicals is referred to as the supporting shipments for chemicals (or for any other final products). Total supporting shipments are derived by applying regional I/O domestic total requirements tables developed by the Bureau of Economic Analysis (BEA) to the products for which a solution is sought.
Estimating domestic supporting shipments for manufactured exports
At the state level, the domestic supporting shipments for manufactured exports were estimated by using the f.o.b. plant values of exports which were derived above, together with tables of state requirements multipliers supplied by the Regional Economic Analysis Division of the BEA. Supporting shipments at the national level were calculated using BEA’s national table. These tables were derived from the I/O tables and exclude requirements from outside the region covered by the table. Hence, the national table excludes requirements from foreign sources and each state table excludes requirements from sources outside the state.
Estimates of domestic national output required for the value of manufactured exports were derived using the following two-step procedure:
- Direct exports by detailed NAICS manufacturing industry were multiplied by the total national requirements multipliers to obtain total domestic output required.
- Total domestic output minus direct exports yields total supporting shipments output.
Supporting shipments of manufacturing industries by state
The value of state supporting shipments from an industry is the value of shipments from this industry in this state used as inputs to this and other industries during the production of exports or inputs to the production of exports. State supporting shipments were calculated in two phases. In the first phase, intrastate manufactured supporting shipments were calculated for each state using state multipliers. State multipliers were derived from the I/O tables and exclude requirements from outside each state. The estimate of intrastate output required for the value of manufactured exports from a state was derived using state multipliers and the same two step procedure used for the national estimates.
In the second phase, the difference between the sum of the intrastate supporting shipments and the national supporting shipments from each manufacturing industry was allocated to states. This difference is the value of inter-state supporting shipments from each industry. The value of inter-state supporting shipments from each industry is the value of shipments from this industry that are shipped across state lines for use by this and other industries in the production of exports or inputs to the production of exports in other states.
The value of national total inter-state supporting shipments from each manufacturing industry was allocated to states on the basis of the distribution of available shipments by that industry across states from the Annual Survey of Manufactures.
When the total value of supporting shipments from each manufacturing industry in each state was determined, employment associated with those values was calculated. The ratio of total employment to total value of shipments for each manufacturing industry in each state was calculated using figures from the Annual Survey of Manufactures. Next, the value of total supporting shipments from each industry in each state was multiplied by the ratio of employment to value of shipments for that industry in that state to obtain an estimate of the total employment associated with providing those supporting shipments. National supporting manufacturing employment for each industry was obtained by summing the supporting employment in each state for that manufacturing industry.
Supporting employment associated with nonmanufacturing industries
The supporting employment in nonmanufacturing industries associated with the production of manufactured exports or of inputs used to produce manufactured exports was estimated by using state total requirements employment multipliers supplied by BEA and the direct export estimates discussed above. These employment multipliers for a given industry in a region show the number of full- and part-time jobs that state industries provide, both direct and supporting, in order for the given industry to deliver $1 million of output to final demand. Direct exports by detailed NAICS manufacturing industry were multiplied by the employment requirements multipliers to obtain export-related employment in nonmanufacturing industries providing inputs to either the production of final goods for export, or the production of other inputs necessary for the manufacture of exports.
As was done for supporting shipments of manufacturing industries, these calculations were made at the national level with national exports and national multipliers, and for each state with exports from that state and multipliers for that state. The use of both national-level and state-level multipliers resulted in a difference between the sum of the state employment for each industry and national employment for that industry. Utilizing national export-related employment as the control total for each industry, this difference was allocated proportionally across the states using the initial state export employment data for each industry.
On an unadjusted basis, if a state accounted for 10 percent of the export employment, it received 10 percent of the adjustment.
Plant-to-port supporting employment
The port value of manufactured exports in 2006 was approximately $809 billion, and it was estimated that the f.o.b. plant value of these goods was $710 billion. The difference of $99.3 billion represents transportation costs of moving these goods (mainly to seaports but also to airports and rail or truck border crossing points) and the margin, or markup of exporters, which is a component of wholesale trade. These costs were split (80 percent / 20 percent) on the basis of the 2005 distribution costs in Table C, “Composition of NIPA Final Demand Rims II Industry Aggregations Final Use Code F04000.” $79.5 billion of the $99.3 billion difference was allocated to wholesale trade and the remaining $19.8 billion was allocated to transportation.
Data from BEA on “gross domestic product by industry” were used to calculate ratios of full- and part-time employees (employment) to gross domestic product by industry for “Transportation” and for “Wholesale Trade.” The amount allocated to each industry was multiplied by that industry’s ratio to obtain an estimate of plant-to-port supporting employment of that industry. These national totals were allocated to states using the distribution of employment across states for transportation and for wholesale trade in the County Business Patterns data. The estimate of transportation employment was added to the previously calculated supporting employment in "transportation, communications, and utilities". The estimate of wholesale trade employment was added to the previously supporting employment in "Trade".
[Excel] or the letters [xls] indicate a document is in the Microsoft® Excel® Spreadsheet Format (XLS). To view the file, you will need the Microsoft® Excel® Viewer ![]() available for free from Microsoft®.
available for free from Microsoft®.
This symbol ![]() indicates a link to a non-government web site. Our linking to these sites does not constitute an endorsement of any products, services or the information found on them. Once you link to another site you are subject to the policies of the new site.
indicates a link to a non-government web site. Our linking to these sites does not constitute an endorsement of any products, services or the information found on them. Once you link to another site you are subject to the policies of the new site.