While the Share of Uninsured Remained at About 8% in 2023, Rates Varied by Age and Poverty Level
The percentage of people without health insurance coverage in 2023 was 8%, not significantly higher than the 7.9% uninsured rate in 2022, according to a U.S. Census Bureau report released today.
The report Health Insurance Coverage in the United States: 2023, reveals health insurance coverage rates and type between 2022 and 2023 for children under age 19, working-age adults ages 19 to 64, and adults age 65 and older.
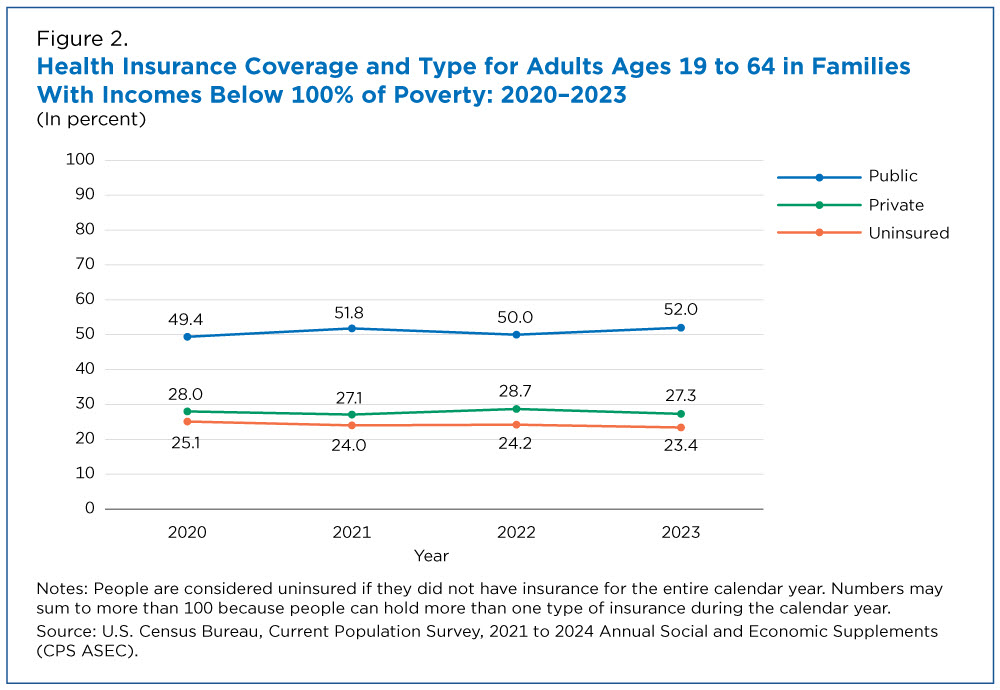
About a quarter of working-age adults in poverty were uninsured each year between 2020 and 2023.
The family income-to-poverty ratio provides a measure of a family’s economic resources. This ratio compares family income to a poverty threshold based on the age and number of family members.
People are classified as being in poverty if their family income is less than the poverty threshold. Family resources may determine the ability to afford private health insurance, and families below certain thresholds may qualify for public health insurance, such as Medicaid.
Age may also factor into individuals’ access to health insurance coverage and type.
Children under age 19 may have health coverage through a variety of sources, including a parent’s private plan or public programs like Medicaid or the Children’s Health Insurance Program (CHIP).
Adults ages 19 to 64 generally have lower coverage rates than those under age 19 and adults age 65 and older. That’s because their coverage is often directly tied to employment. They do not qualify for programs intended for children and only qualify for public programs under specific medical or income-level circumstances.
Health Insurance Coverage by Age and Income-to-Poverty Ratio
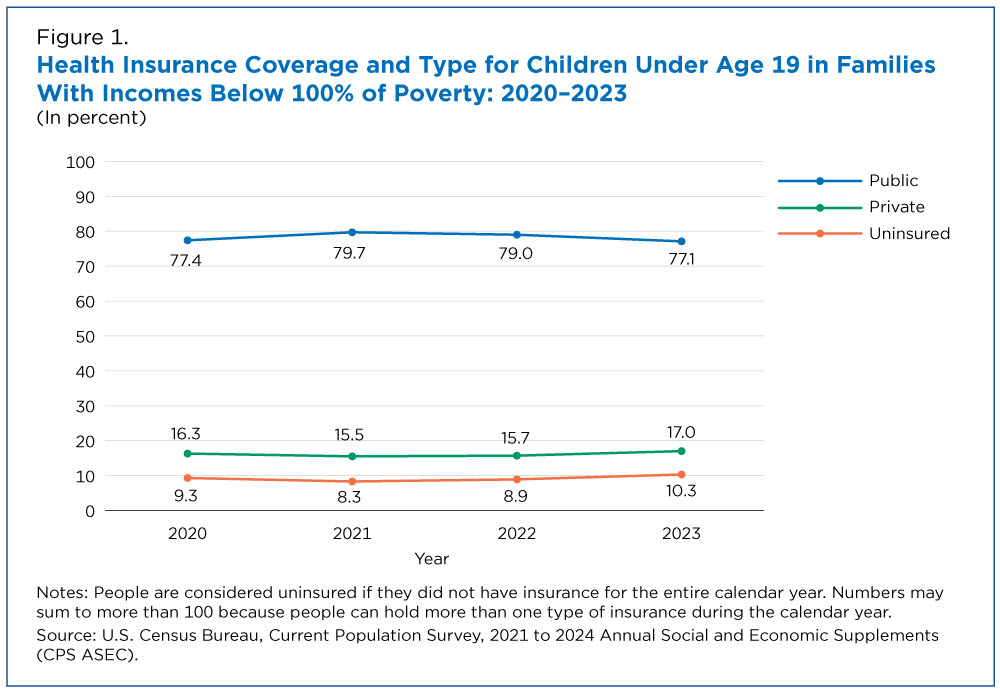
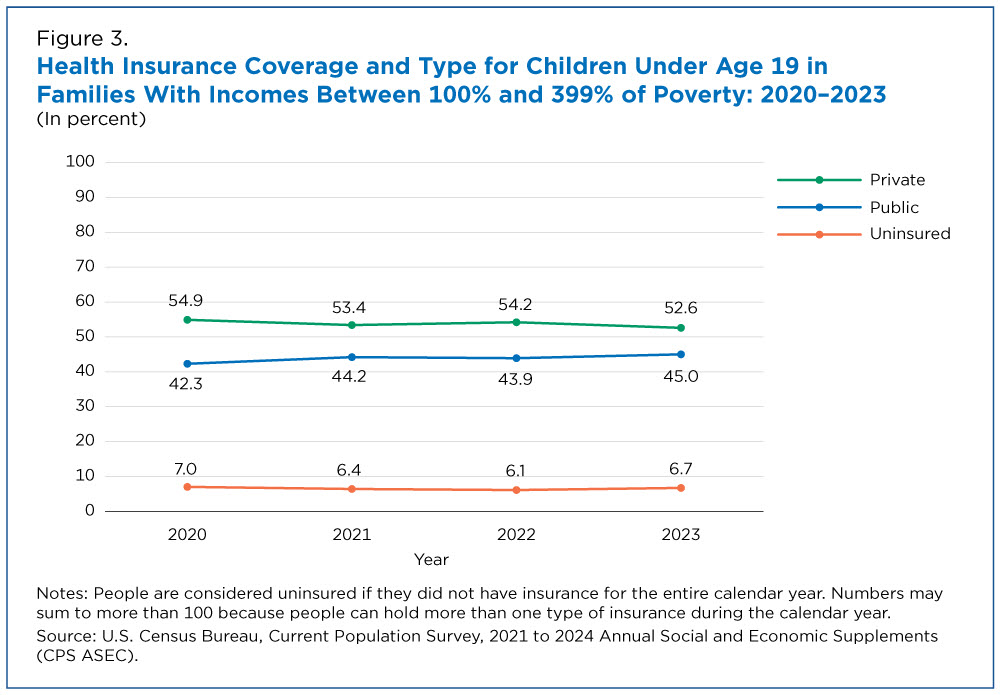
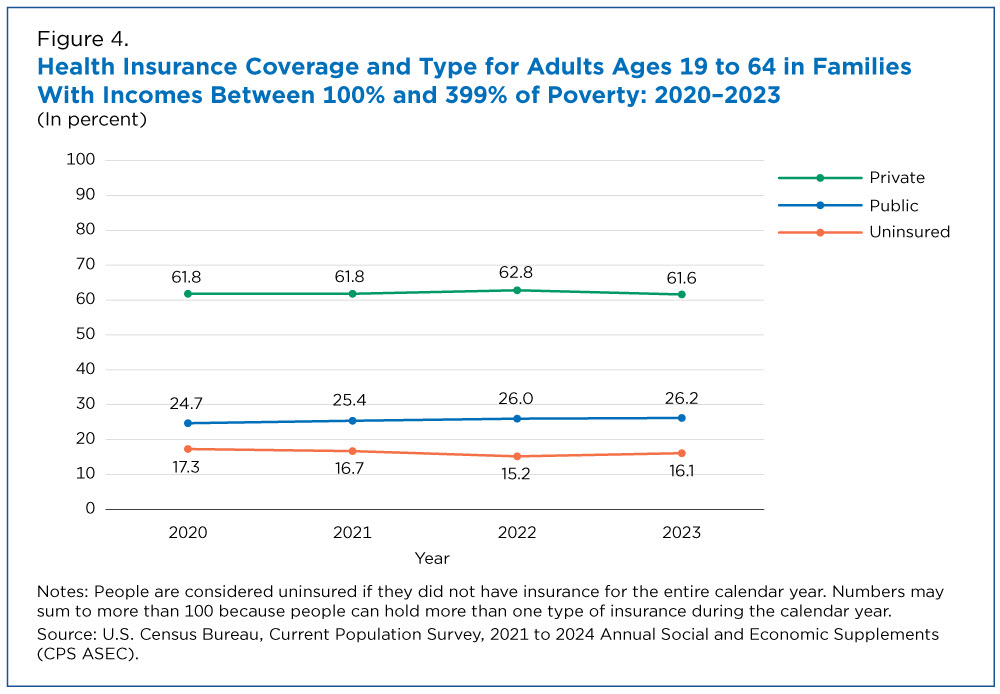
From 2020 to 2023, the share of children under 19 and working-age adults ages 19 to 64 with health coverage differed depending on income and poverty levels.
Among those who lived below the poverty level:
- Most children under 19 and working-age adults had public insurance. In each year, over three-quarters of children under 19 and about half of working-age adults in poverty had public coverage.
- The uninsured rate of children under 19 in poverty ranged from 8.3% to 10.3% between 2020 and 2023.
- About a quarter of working-age adults in poverty were uninsured each year between 2020 and 2023.
Among those living in families with incomes between 100% and 399% of poverty thresholds:
- More than half of children under 19 and working-age adults had private insurance.
- The percentage of children under 19 with public insurance rose from 42.3% in 2020 to 45% in 2023.
- About a quarter of working-age adults had public insurance from 2020 to 2023.
- The uninsured rate among children under 19 dipped between 2020 and 2022 from 7.0% to 6.1% and was 6.7% in 2023.
- The uninsured rate for working-age adults fell from 17.3% in 2020 to 15.2% in 2022, increasing to 16.1% in 2023.
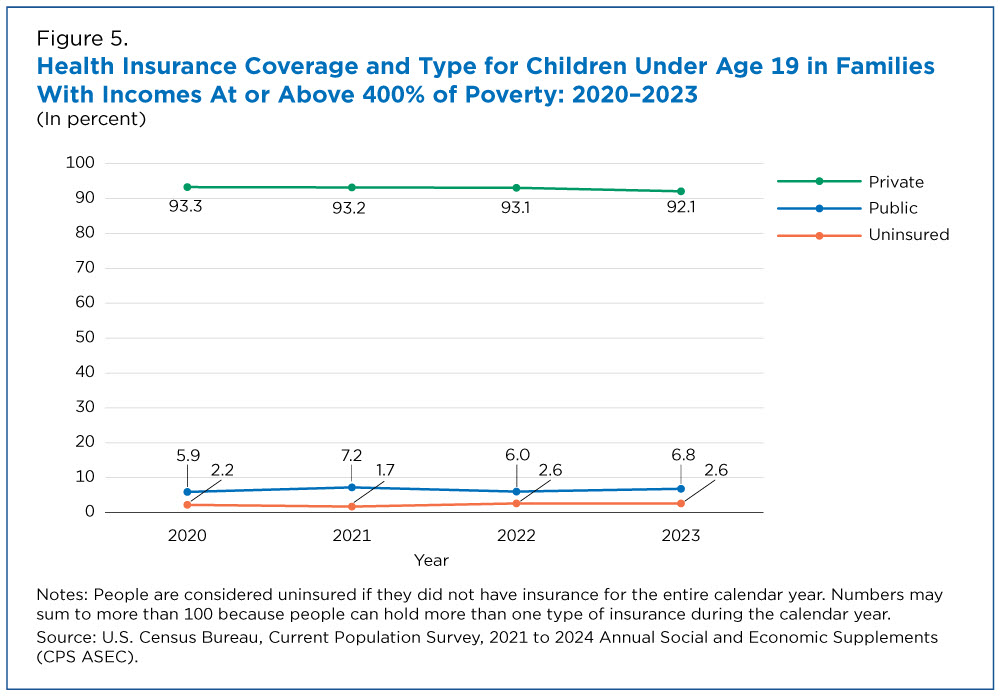
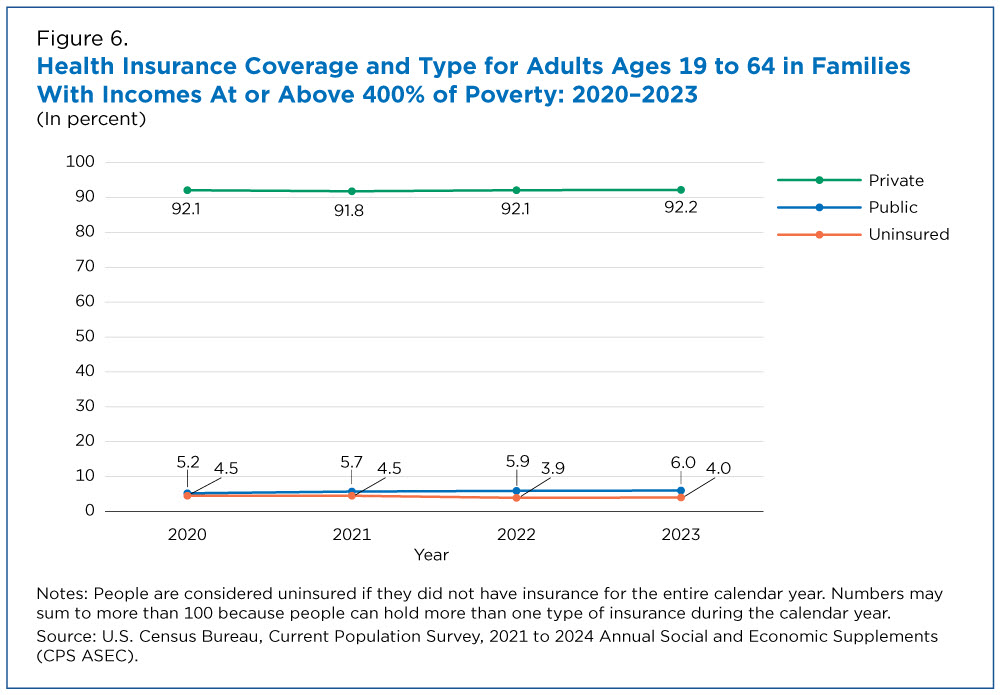
Among those in families with incomes in the highest income-to-poverty ratio group (at or above 400% of poverty):
- Over 90% of children under 19 and working-age adults had private insurance.
- The share of children under 19 with public insurance rose from 5.9% in 2020 to 6.8% in 2023.
- The share of working-age adults with public insurance rose from 5.2% in 2020 to 6% in 2023 while their uninsured rate fell from 4.5% to 4% during this period.
Definitions and more information on confidentiality protection and sampling and nonsampling error are available in the technical documentation.
All comparative statements in this article have undergone statistical testing and, unless otherwise noted, are statistically significant at the 10% significance level.
Related Statistics
Subscribe
Our email newsletter is sent out on the day we publish a story. Get an alert directly in your inbox to read, share and blog about our newest stories.
Contact our Public Information Office for media inquiries or interviews.
-
Income and PovertyMedian Household Income Increased in 2023 for First Time Since 2019September 10, 2024Non-Hispanic White households were the only group with higher incomes in 2023. Asian household median income remained the highest among all groups.
-
Income and PovertySupplemental Poverty Measure Below Official Poverty Rate in 32 StatesSeptember 10, 2024Unlike the official poverty rate, the Supplemental Poverty Measure accounts for government assistance to low-income families.
-
Income and PovertySupplemental Poverty Measure Rose in 2023 for Second Consecutive YearSeptember 10, 2024The SPM, which accounts for noncash government assistance, increased to 12.9% in 2023, higher than pre-pandemic levels.
-
Business and EconomyExploring New Frontiers With the Quarterly Workforce IndicatorsJanuary 13, 2026New data on employment and hiring for detailed national industries enable data users to explore the composition and dynamics of specialized workforces.
-
Business and EconomyEconomic Census Highlights Variety of Products Many Industries SellJanuary 06, 2026North American Product Classification System (NAPCS) Data Release from the 2022 Economic Census is a treasure trove of unique information.
-
Business and EconomyRevenue and Employment Trends Reveal Shifts in U.S. EconomyDecember 30, 2025Revenue and employment losses in select retail industries continued, while online sales brokers and local delivery boomed.
-
EmploymentThe Stories Behind Census Numbers in 2025December 22, 2025A year-end review of America Counts stories on everything from families and housing to business and income.

