Los Angeles Tops Counties With Most Male and Female Same-Sex Couples
Men in same-sex couples don’t always live in the same parts of the country as women in same-sex couples, according to 2020 Census data that show where same-sex couple households live within each state by sex.
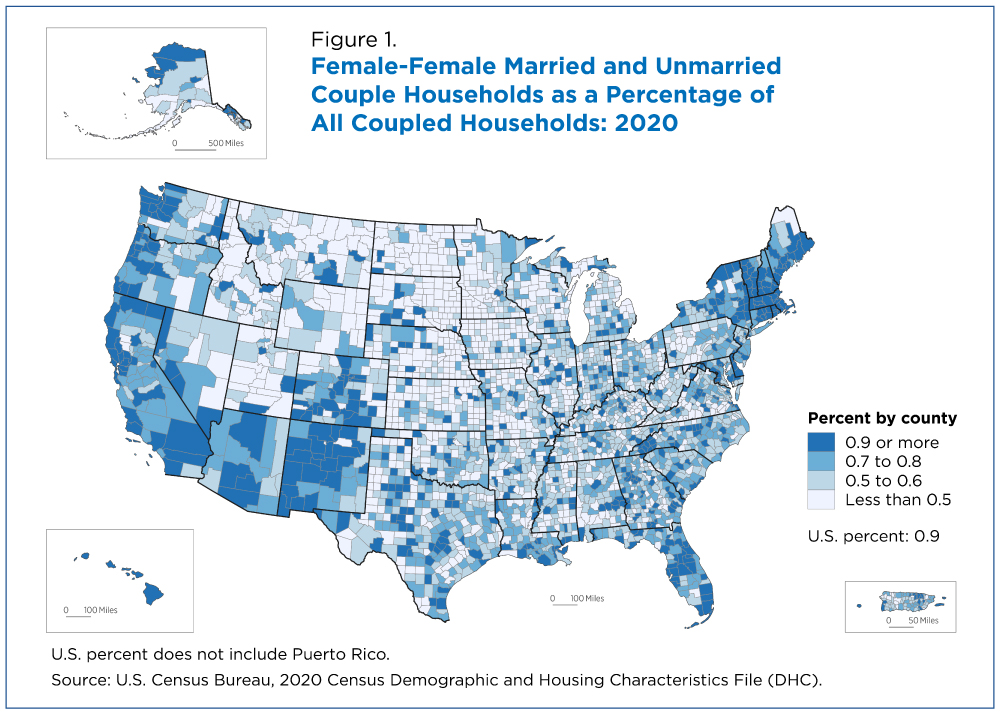
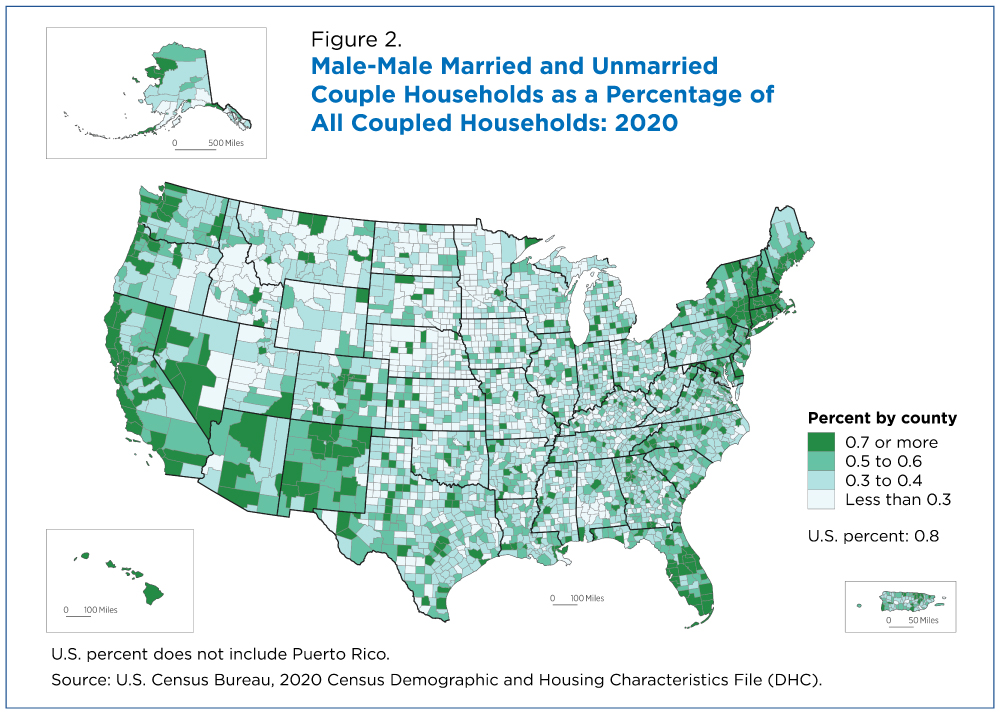
County-level maps show higher percentages of both types of same-sex couples in Florida, the Northeast and on the West Coast.
Overall, female same-sex couples made up 0.9% of U.S. coupled households and male same-sex couples made up an additional 0.8% of U.S. coupled households in 2020. For both sexes, these coupled households were often in and around the population centers of each state (Figures 1 and 2).
County-level maps show higher percentages of both types of same-sex couples in Florida, the Northeast and on the West Coast. Counties in those regions also had the highest number of same-sex couples and counties with the highest percentage of same-sex coupled households.
Where Female and Male Same-Sex Couples Live Varies
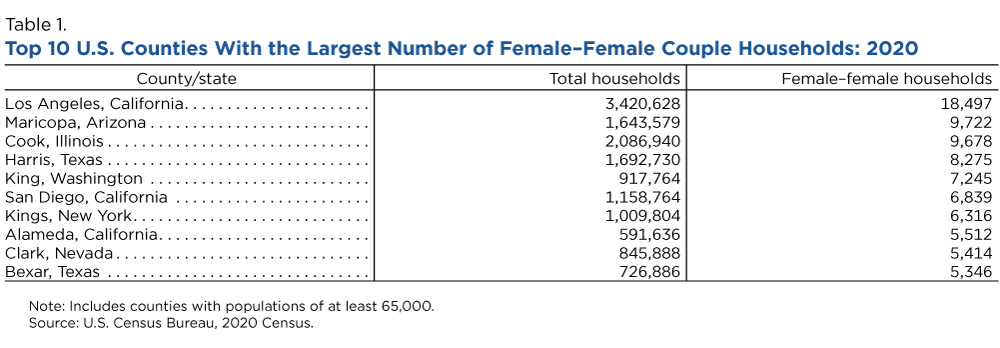
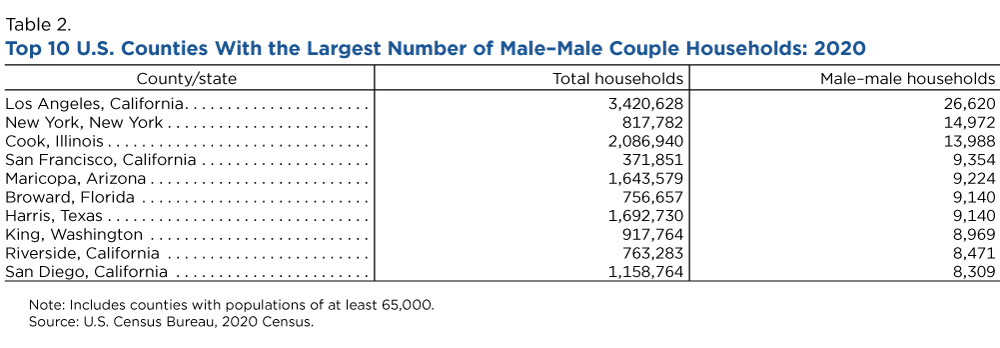
In 2020, Los Angeles County, California, had the highest number of both female and male same-sex couples.
In both Los Angeles and Cook County, Illinois, there were more male-male than female-female coupled households.
Also heading the top-10 list with the most male and female same-sex couples: Maricopa County, Arizona; Harris County, Texas; King County, Washington; and San Diego County, California.
Four counties were in the top 10 only on the female-female couples list: Kings County, New York; Alameda County, California; Clark County, Nevada; and Bexar County, Texas.
Four counties only appeared on the male-male list: New York County, New York; San Francisco County, California; Broward County, Florida; and Riverside County, California.
As expected, most of the counties in the top 10 list had large populations.
Where Female and Male Same-Sex Couples Were Concentrated
While the top 10 list of counties with the highest number of female and male same-sex couples were similar in 2020, counties with the highest share of same-sex couples differed.
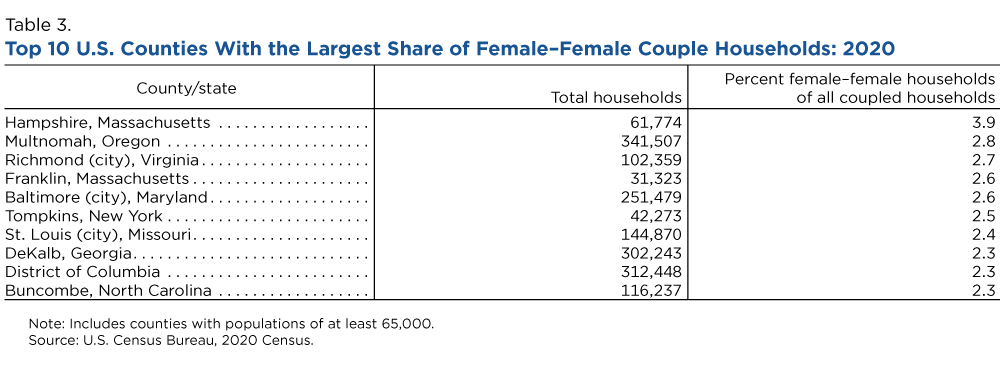
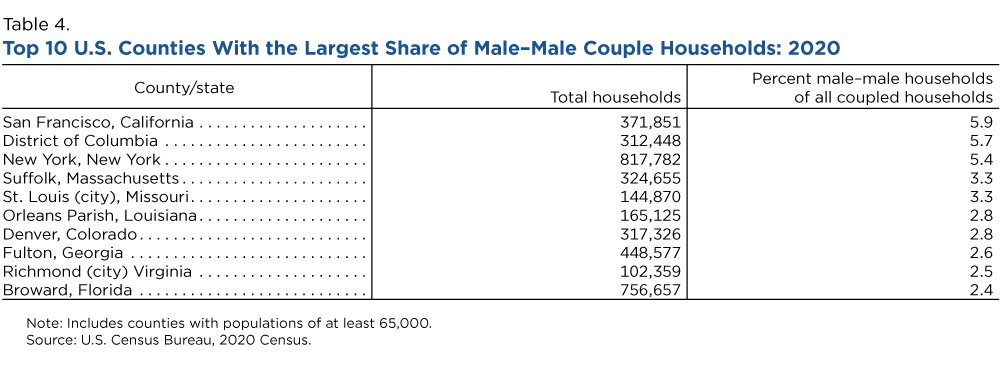
Los Angeles County, for example, fell out of the top 10 lists for highest share of both female and male same-sex couples. But San Francisco County was No. 1 for male-male couples (5.9%).
No counties in California were in the top 10 for share of female-female couples. Hampshire County, Massachusetts, topped the list (3.9% of all coupled households were female-female), followed by Multnomah County, Oregon, (2.8%).
A few counties landed in the top 10 for both female and male same-sex couples but not always in the same spot.
The District of Columbia had the second biggest share of male-male households (5.7%) but was No. 9 for female-female couples (2.3%). The share of male couples was more than double the percentage of female couples in D.C., even though they were both in the top 10.
In Richmond City, Virginia, 2.7% of coupled households were female-female and 2.5% were male-male. Yet, the city ranked third for female and ninth for male same-sex couples.
This review of geographic variation builds on a recent Census report, which compared the characteristics of spouses in opposite-sex and same-sex married couples and also looked at the characteristics by sex of the couple. It also expands on a previous America Counts story, which explored the share of same-sex households in select cities.
Related Statistics
Subscribe
Our email newsletter is sent out on the day we publish a story. Get an alert directly in your inbox to read, share and blog about our newest stories.
Contact our Public Information Office for media inquiries or interviews.
-
Families and Living ArrangementsOver Half of Spouses in Same-Sex Marriages Tied the Knot After 2014A new report provides characteristics and living arrangements of spouses in same-sex and opposite-sex couples.
-
Same-Sex CouplesInterracial Couples More Common Among Same-Sex CouplesMale same-sex couples had higher median household incomes than female same-sex couples even though the shares with both partners working did not differ.
-
Families and Living ArrangementsNumber of Same-Sex Couple Households Exceeded 1 Million in 2021Compare demographic and economic characteristics of U.S. same-sex and opposite-sex couple households in new Census Bureau table package and graphics.
-
EmploymentThe Stories Behind Census Numbers in 2025December 22, 2025A year-end review of America Counts stories on everything from families and housing to business and income.
-
Families and Living ArrangementsMore First-Time Moms Live With an Unmarried PartnerDecember 16, 2025About a quarter of all first-time mothers were cohabiting at the time of childbirth in the early 2020s. College-educated moms were more likely to be married.
-
Business and EconomyState Governments Parlay Sports Betting Into Tax WindfallDecember 10, 2025Total state-level sports betting tax revenues has increased 382% since the third quarter of 2021, when data collection began.
-
EmploymentU.S. Workforce is Aging, Especially in Some FirmsDecember 02, 2025Firms in sectors like utilities and manufacturing and states like Maine are more likely to have a high share of workers over age 55.
