Characteristics and Living Arrangements of Spouses in Same-Sex and Opposite-Sex Marriages
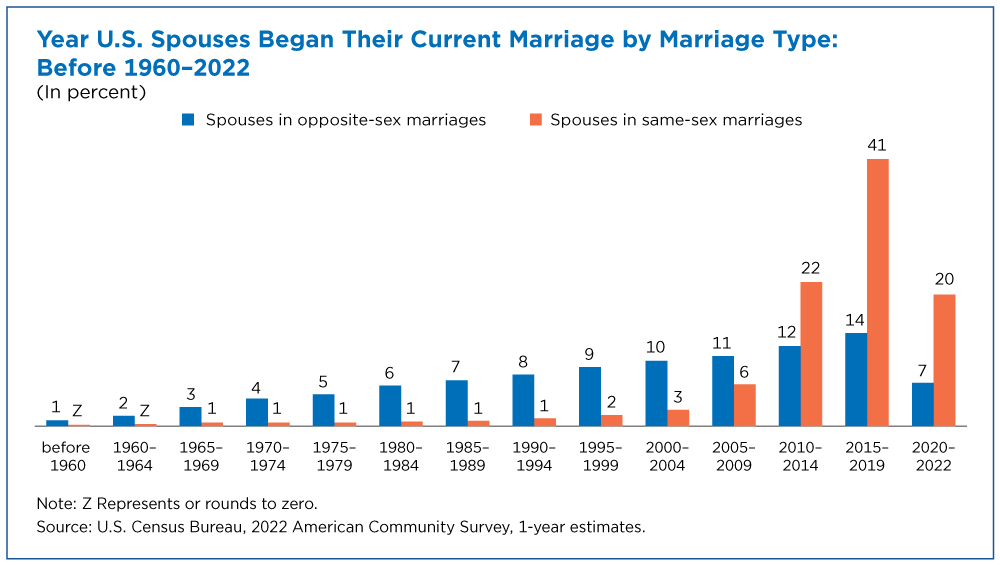
Same-sex marriages reached a peak between 2015 and 2019, right after the U.S. Supreme Court’s 2015 decision to legalize same-sex marriage in all states and most spouses in same-sex marriages tied the knot after 2003, when Massachusetts became the first state to legally recognize same-sex marriages.
About 41% of same-sex spouses married between 2015 and 2019 compared to 14% of those in opposite-sex marriages, according to a new U.S. Census Bureau report that analyzes 2022 data.
By distinguishing between male-male and female-female married couples, the report also examines whether characteristics of spouses in same-sex marriages are similar for men and women.
The report paints a national portrait of spouses in same-sex couples and their households, finding that on average they were younger; more likely to have a bachelor’s degree; and more likely to have married in the past year than those in opposite-sex marriages.
Characteristics of spouses in same-sex and opposite-sex couples differ depending on when they married. For example, spouses in same-sex marriages who married after 2015 tend to be older than those in opposite-sex marriages.
By distinguishing between male-male and female-female married couples, the report also examines whether characteristics of spouses in same-sex marriages are similar for men and women.
How spouses in opposite- and same-sex marriages compared in 2022:
- Among all spouses — regardless of when they married — those in same-sex marriages (46%) were more likely than those in opposite-sex marriages (34%) to be younger than 45. The opposite was true among spouses who married after 2015: 78% of those in opposite-sex marriages were younger than 45 vs. 65% of those in same-sex marriages.
- Out of all spouses, men in opposite-sex marriages (71%) were more likely to be in the labor force and employed than women in opposite-sex marriages (58%). Among same-sex married couples, the percentage of men (74%) and women (75%) who were employed did not significantly differ.
- Children under 18 were more common in opposite-sex married-couple households. About 38% of these households included a child of the householder, compared to 18% of same-sex married-couple households.
- Among households with children, same-sex married-couple households were more likely to have only adopted (21%) or only foster (2%) children of the householder present than opposite-sex married couple households (2% and 0.2% respectively).
- Living in an apartment was twice as common for same-sex married-couple households, consistent with the higher proportion of same-sex married-couple households in urban areas.
Related Statistics
Subscribe
Our email newsletter is sent out on the day we publish a story. Get an alert directly in your inbox to read, share and blog about our newest stories.
Contact our Public Information Office for media inquiries or interviews.
-
Families and Living ArrangementsSame-Sex Married Couples Less Likely to Be Same Age, Race, EthnicitySurvey data reveal patterns of social and economic similarity between same- and opposite-sex spouses.
-
Same-Sex CouplesInterracial Couples More Common Among Same-Sex CouplesMale same-sex couples had higher median household incomes than female same-sex couples even though the shares with both partners working did not differ.
-
IncomeHow Income Varies by Race and GeographyJanuary 29, 2026Median income of non-Hispanic White households declined in five states over the past 15 years: Alaska, Connecticut, Louisiana, Nevada, and New Mexico.
-
HousingRental Costs Up, Mortgages Stayed FlatJanuary 29, 2026Newly Released American Community Survey compares 2020-2024 and 2015-2019 housing costs by county.
-
HousingShare of Owner-Occupied, Mortgage-Free Homes Up in 2024January 29, 2026The share of U.S. homeowners without a mortgage was higher in 2024 than a decade earlier nationwide and in every state, though not all counties saw increases.
-
PopulationU.S. Population Growth Slowest Since COVID-19 PandemicJanuary 27, 2026The decline in international migration was felt across the states, though its impact varied.


