Most Counties Had an Undercount of Young Children in the 2020 Census
A new analysis of the undercount of young children in the 2020 Census shows variation by county and a relationship between net coverage errors and socioeconomic characteristics like family structure and poverty.
The 2020 Demographic Analysis (DA) found that children ages 0 to 4 had a national net coverage error estimate of -5.46% in the 2020 Census — a larger undercount than any other age group. This means the number of young children counted in the 2020 Census was approximately 1 million lower than the benchmark population estimate.
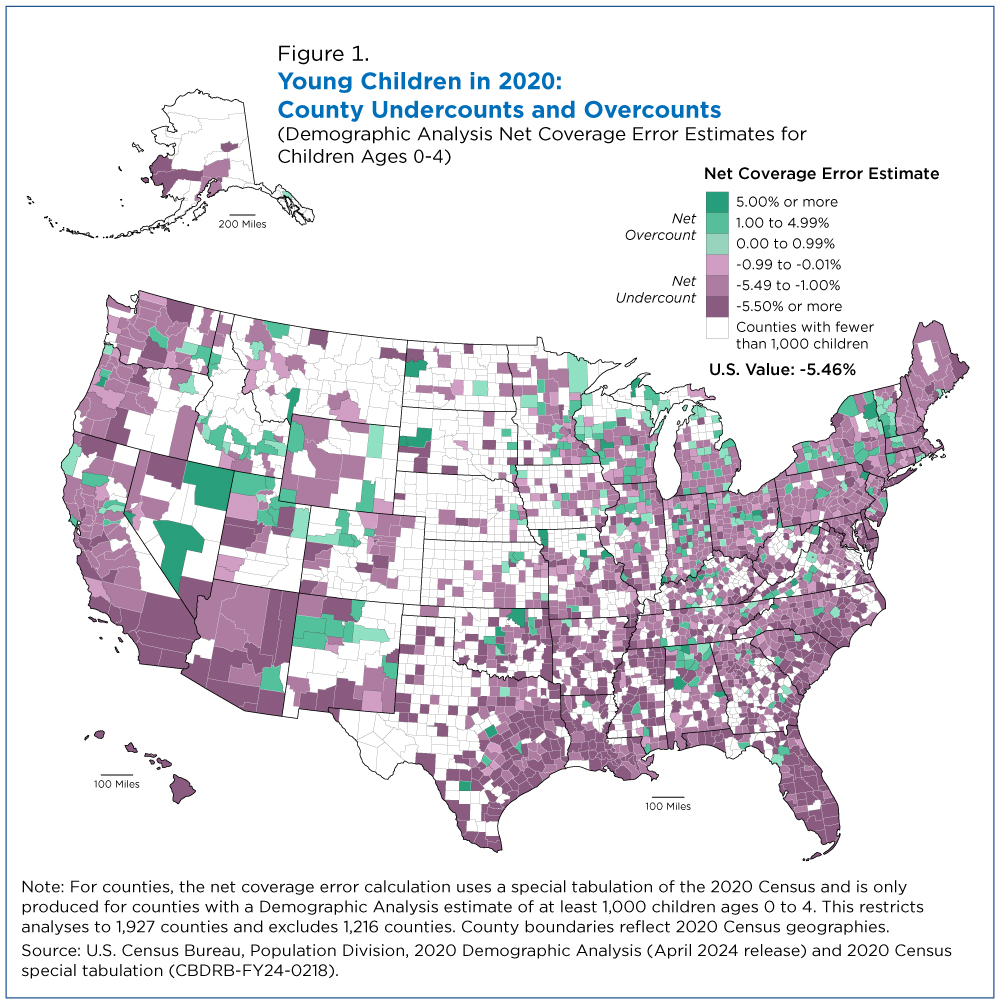
The new county-level analysis shows undercounts of young children in counties across the country but a substantial number were clustered along the West Coast, in the South, and in the Southwest, particularly in the border regions of Arizona, California, and Texas.
The undercount of young children is a persistent problem in the decennial census and demographic surveys. Many countries face similar challenges in their censuses and surveys.
The new county-level analysis shows undercounts of young children in counties across the country but a substantial number were clustered along the West Coast, in the South, and in the Southwest, particularly in the border regions of Arizona, California, and Texas.
The analysis also found a relationship between net coverage error and several county-level sociodemographic characteristics including household structure variables, the percentage of children in poverty, and the percentage of adults without a high school diploma. We chose these specific characteristics because they cut across all race and ethnicity groups.
Analyzing Undercounts of Young Children
The U.S. Census Bureau used two approaches to estimate net coverage error of the 2020 Census:
- DA, which uses birth and death records, data on international migration, and Medicare Enrollment data to produce population estimates that are compared to the census to estimate net coverage error.
- The Post-Enumeration Survey (PES) was conducted shortly after the census data were collected. The results of the survey were matched to the census results to produce dual-system estimates of the population, which are compared to the census to produce net coverage error estimates.
While both methods have their strengths and limitations, DA is a better approach for assessing the census count of young children because the estimate comes primarily from the birth records, which are considered 100% complete in the United States.
The Census Bureau produced a series of experimental DA net coverage error estimates for children ages 0 to 4 at the state and county levels.
These estimates are experimental because they were developed with some new data and methods relative to the official national-level DA estimates released in December 2020. The distinction also takes into account that there may be more error in the county estimates than in the national estimates.
The official DA net coverage error estimates for all ages are only available at the national level because we use historical birth records as the foundation for DA population estimates. The birth records include information about where a person was born, but we do not have the data and methods to track migration over the life course.
However, we are confident we can estimate migration of young children over a relatively short period. The experimental DA estimates were produced using birth records from 2015 to 2020, so we only had to estimate migration for less than five years.
There are limitations to the data and methods used for the experimental state and county estimates, which is why we are only releasing data for 1,927 of 3,143 U.S. counties with a DA 0-4 population estimate of 1,000 or more.
One issue is that births might not be geocoded correctly and thus could be assigned to a different state or county.
For example, mothers from Virginia and Maryland may give birth in the neighboring District of Columbia. If the birth is assigned to D.C. instead of the actual state of residence, the DA population estimate will be too high and show an inflated undercount for D.C.
Geocoding can also be an issue at the county level.
For example, we found some cases in which one small rural county had a large undercount and an adjacent county had a large overcount. We assume that the county with the undercount does not have a hospital and that a number of births for that county are being assigned to the neighboring county with a hospital.
There can also be errors in the other components of population change — deaths, domestic migration and international migration — but the births are the largest portion of the overall DA estimate.
Data Visualization
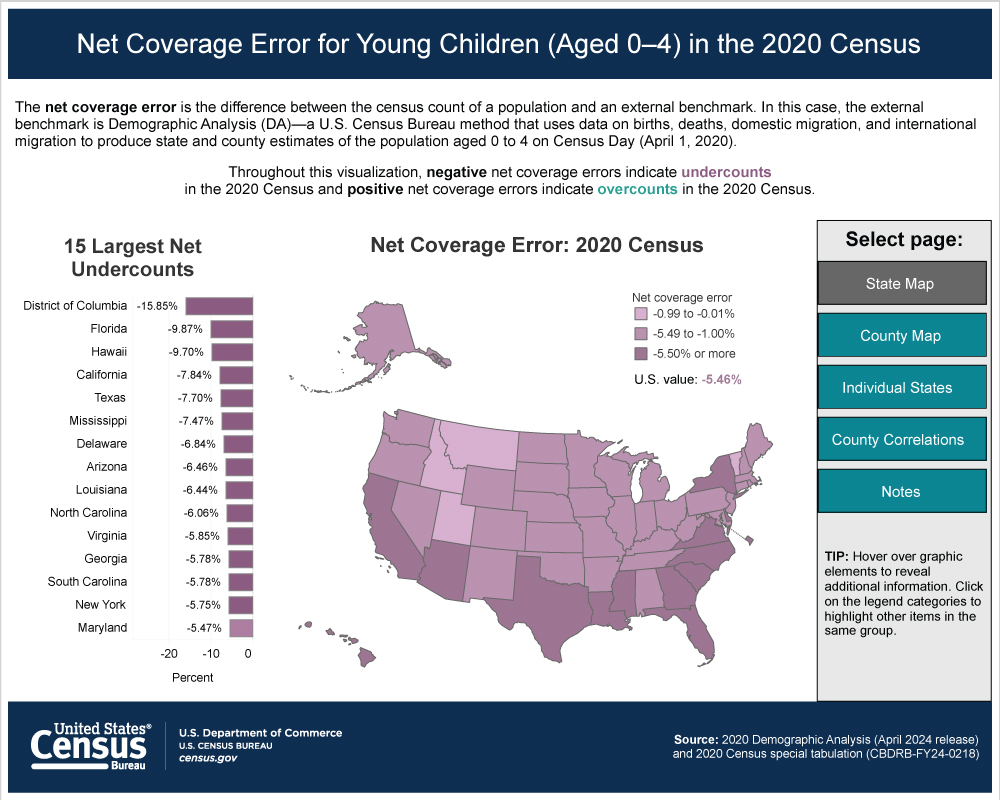
A new data visualization allows users to explore the results of the experimental DA state and county net coverage error estimates.
The tool includes state maps, county maps and graphs showing the relationships between the DA net coverage error estimates and socioeconomic characteristics of counties. Select the image below to access the data visualization.
Note: Select the image to go to the interactive data visualization.
State Results
The DA state net coverage error estimates for young children ranged from -15.85% for the District of Columbia (D.C.) to -0.02 for Vermont. As noted above, the large undercount for D.C. may be due to the large number of children from Virginia and Maryland that are born in D.C. hospitals.
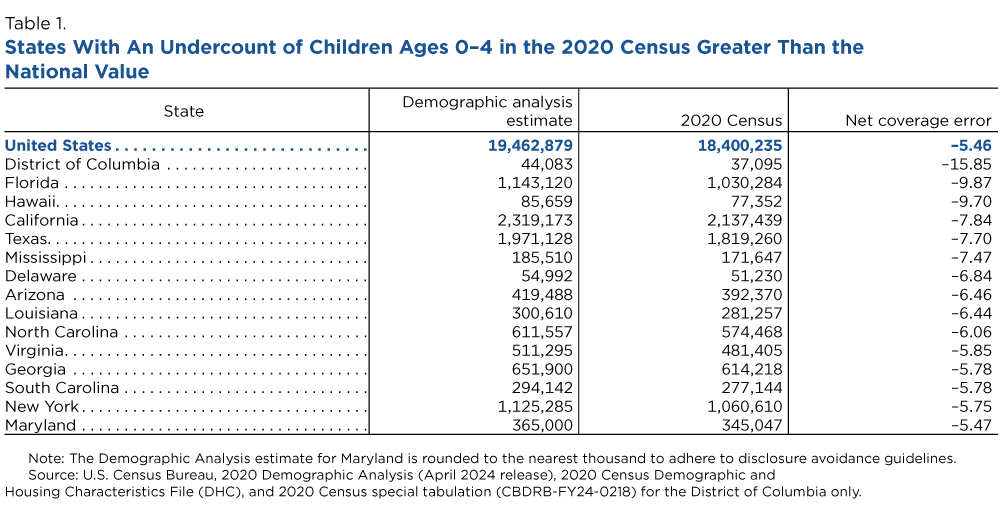
There were 15 states with an estimated net coverage error estimate below the national average of -5.46%, meaning they had larger undercounts than the nation (Table 1).
These states were found in all regions of the country but the majority (about two-thirds) were in the South: the District of Columbia (-15.85%), Florida (-9.87%), Texas (-7.70%), Mississippi (-7.47%), Delaware (-6.84%), Louisiana (-6.44%), North Carolina (-6.06%), Virginia (-5.85%), Georgia (-5.78%), South Carolina (-5.78%) and Maryland (-5.47%).
Three of the remaining states were in the West: Hawaii (-9.70%), California (-7.84%), and Arizona (-6.46%), and New York (-5.75%) was the only state in the Northeast.
Net Coverage Error by County
The map of county-level net coverage error estimates (Figure 1) shows interesting patterns for counties with large undercounts and overcounts of young children.
Counties in dark purple had an undercount larger than the -5.46% national value and were widespread.
There were also counties that had no coverage error or an overcount. There were fewer of these counties than undercounted counties (16% compared to 84%) and they tended to be less spread out. We did see some clustering among these counties in states such as Nevada, New Mexico, New York and Utah.
Relationships Between Net Coverage Errors and Socioeconomic Variables
We do not have a method for estimating net coverage errors of young children by socioeconomic characteristics, but we can look at county-level correlations between the net coverage error estimates and other county characteristics.
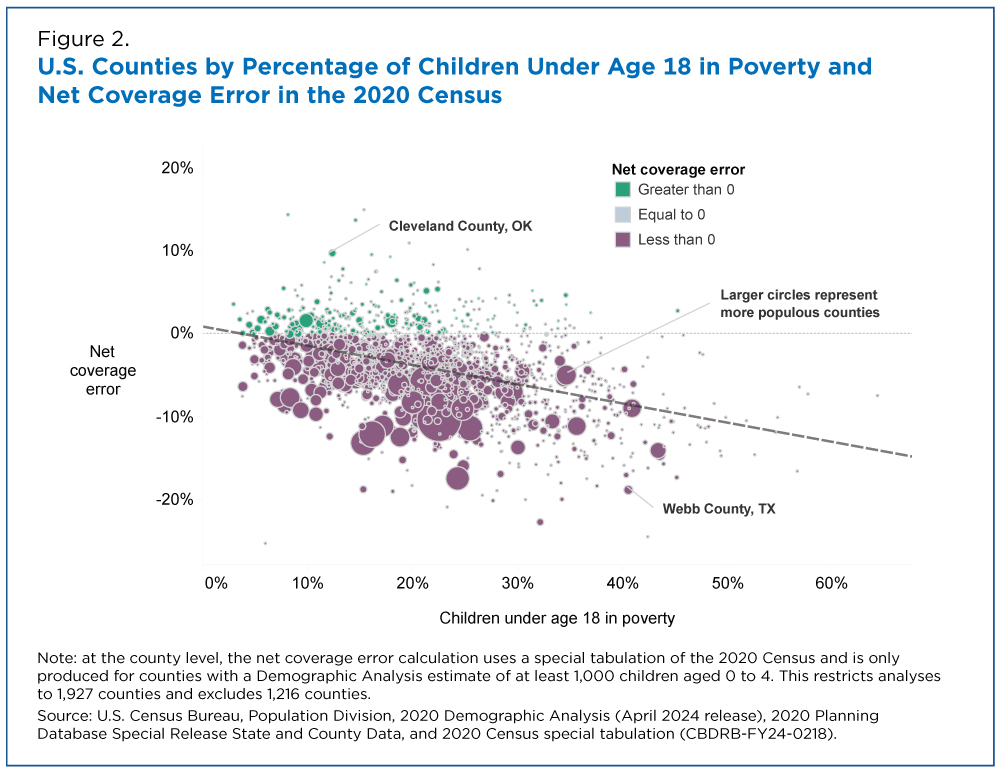
Figure 2 shows the relationship between the county net coverage error estimates and the percentage of children in poverty.
The green circles represent counties with an overcount, purple circles represent counties with an undercount, and grey circles represent counties with neither an overcount nor an undercount.
The size of each circle is proportional to the DA population estimate for the county. As mentioned above, 84% of counties where we calculated a 2020 Census DA net coverage error estimate have an undercount for young children.
The graph shows that the coverage of young children tends to decrease as the percentage of children in poverty increases.
For example, Cleveland County, Oklahoma, is in the top left corner of the graph because it had a relatively low percentage of young children in poverty and an overcount for young children in the 2020 Census.
Alternatively, Webb County, Texas, is in the bottom right corner and had a relatively high percentage of children in poverty and a large undercount of young children in the 2020 Census.
For more information about how the percentage of children in poverty is measured, refer to the 2020 Planning Database Special Release State and County Data [PDF <1.0 MB].
The data visualization includes similar graphs for other socioeconomic variables including the percentage of:
- Female-headed households.
- Adults without a high school diploma.
- Renter-occupied housing units.
Again, the data and methods are not available to calculate net coverage error estimates by these different characteristics, but we can analyze the relationships between them and the DA estimates of undercounts and overcounts. This information will help us plan for the 2030 Census.
Disclosure Avoidance
For the experimental DA series, we use 2020 Census data to calculate the net coverage error estimates.
The data for the state-level estimates come from the 2020 Census Demographic and Housing Characteristics (DHC) file. The 2020 Census data used for the county-level estimates come from a special tabulation developed by the Census Bureau’s Disclosure Avoidance System (DAS) for this release.
As a result, the 2020 Census counts shown in the tables may differ from those released at the county level in the DHC file.
The county-level 2020 Census counts for the population ages 0 to 4 produced by the DAS for this release are more accurate than the corresponding counts in the DHC file. This also makes the net coverage error estimates more accurate than if we had used the DHC file.
Working to Improve the Count of Young Children
We are continuing to explore what the characteristics of counties with large undercounts and overcounts for young children can tell us about how to improve the count of young children in the 2030 Census.
Last decade, the Census Bureau put significant effort into researching this problem and trying to improve the count of young children in the 2020 Census, yet it remained the largest undercount of any age group. Of course, it is possible that without these additional efforts, the undercount for young children in the 2020 Census may have been larger.
The experimental state and county DA estimates of net coverage error for young children can help us understand more about the 2020 Census and help prepare us for the next decennial census.
While we can’t produce DA net coverage error estimates by socioeconomic characteristics, we can better understand what factors may be leading to young children being missed from the Census by looking at the characteristics of counties with large undercounts and overcounts.
As we prepare for the 2030 Census, research on the link between the experimental DA net coverage error estimates and socioeconomic characteristics of counties could inform changes to census operations, outreach and marketing efforts and other decennial activities.
Related Statistics
-
Stats for StoriesNational Child's Day: November 20, 2023In 2021, the majority (71%) of America’s 72.3M children under 18 lived with two parents and the next largest share (20.9%) lived with their mothers only.
-
2020 Census Decade: About the 2020 CensusHere is an overview of the 2020 Decennial Census.
-
Demographic Analysis (DA)Demographic analysis is a technique used to develop an understanding of the age, sex, and racial composition of a population and how it has changed over time.
-
Post-Enumeration SurveysThe Post-Enumeration Survey measures the accuracy of the census by surveying people and matching responses to the census to determine coverage.
Subscribe
Our email newsletter is sent out on the day we publish a story. Get an alert directly in your inbox to read, share and blog about our newest stories.
Contact our Public Information Office for media inquiries or interviews.
-
PopulationDespite Efforts, Census Undercount of Young Children PersistsMarch 10, 2022Improving data for young children in all Census Bureau products is the focus of a new cross-directorate working group.
-
PopulationCensus Bureau Today Releases 2020 Census Undercount, Overcount Rates by StateMay 19, 2022The 2020 Post-Enumeration Survey provides an estimate of the undercount or overcount results for each state and by census operation.
-
PopulationWho Was Undercounted, Overcounted in the 2020 Census?March 10, 2022The U.S. Census Bureau used two measures of coverage to estimate who was missed or counted more than once in the 2020 Census.
-
EmploymentThe Stories Behind Census Numbers in 2025December 22, 2025A year-end review of America Counts stories on everything from families and housing to business and income.
-
Families and Living ArrangementsMore First-Time Moms Live With an Unmarried PartnerDecember 16, 2025About a quarter of all first-time mothers were cohabiting at the time of childbirth in the early 2020s. College-educated moms were more likely to be married.
-
Business and EconomyState Governments Parlay Sports Betting Into Tax WindfallDecember 10, 2025Total state-level sports betting tax revenues has increased 382% since the third quarter of 2021, when data collection began.
-
EmploymentU.S. Workforce is Aging, Especially in Some FirmsDecember 02, 2025Firms in sectors like utilities and manufacturing and states like Maine are more likely to have a high share of workers over age 55.


