Detailed Coverage Estimates for the 2020 Census Released Today
The U.S. Census Bureau today released the most detailed estimates to date of the undercount and overcount in the 2020 Census, known as coverage error.
Coverage error, a measure of disagreement between the census counts and independent estimates of the population size, occurs when people are not counted (undercount) or are counted more than once or were included in error (overcount).
The results show that there was no statistically significant net national coverage error. In effect, there was not a statistically significant overcount or undercount for the total population. But there were some populations that were undercounted or overcounted such as young children, older adults and working-age men.
The Census Bureau uses two different approaches to measure coverage error in the decennial census: Demographic Analysis (DA) and the Post-Enumeration Survey (PES).
These programs provide some of our strongest indicators of the quality of the 2020 Census.
In effect, there was not a statistically significant overcount or undercount for the total population. But there were some populations that were undercounted or overcounted such as young children, older adults and working-age men.
The PES results released today also provide coverage errors by race and ethnicity.
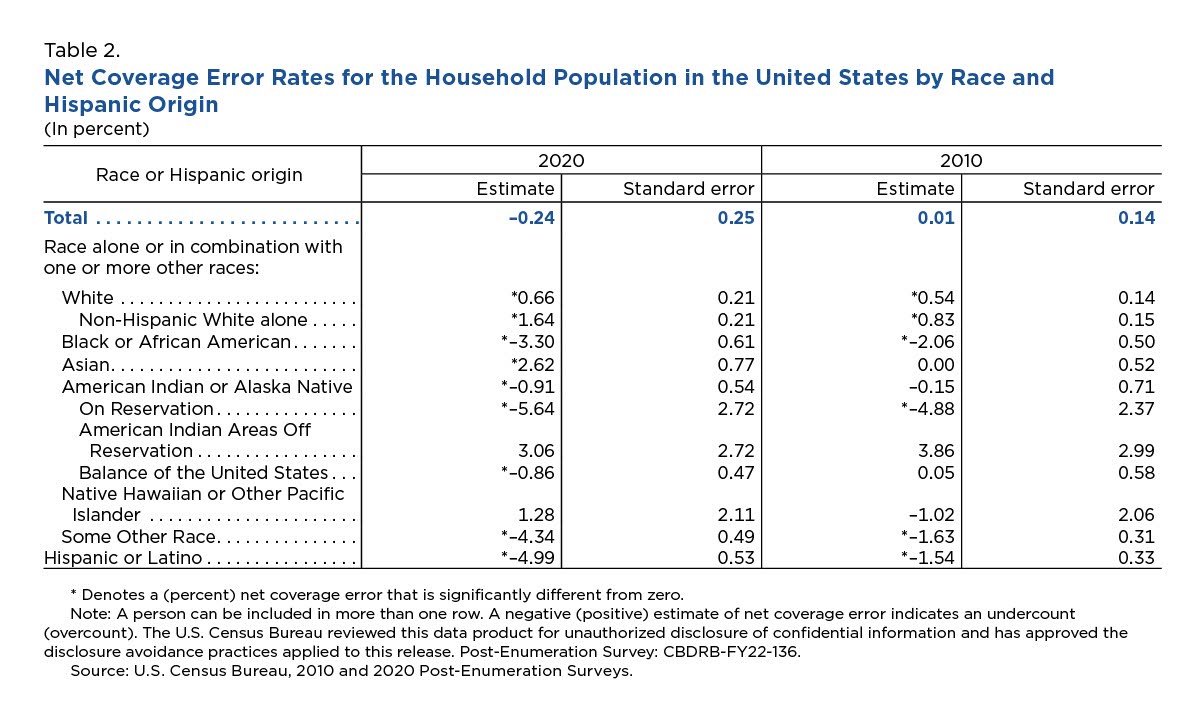
These results showed statistically significant undercounts for the following populations: Black or African American alone or in combination, American Indian or Alaska Native alone or in combination, the Some Other Race alone or in combination, and Hispanic or Latino.
The PES found statistically significant overcounts for the White alone or in combination, Non-Hispanic White alone, and Asian alone or in combination populations. We did not find a statistically significant overcount or undercount for the Native Hawaiian or Other Pacific Islander population.
Although people may want to know whether there was an undercount specifically for their city or neighborhood, it’s important to note that the coverage measurement programs are not that geographically precise: both the PES and DA are currently only available at the national level.
However, additional PES results for the total population for states will be available this summer. The PES will not release metrics below the state level. Experimental estimates for DA at the state and county level for the population ages 0 to 4 will also be released at a later date.
How We Measure Coverage Error
The Census Bureau has a long history of measuring coverage error in the decennial census.
DA was first used to evaluate coverage in the 1960 Census, while post-enumeration surveys were used as far back as 1950.
Although both DA and the PES produce alternative estimates of the U.S. population to compare to the census counts, there are key differences in the methods used:
- DA uses vital records, survey and population register data on international migration, and Medicare enrollment to build an estimate of the total U.S. population.
- The PES uses a technique called dual-system estimation that asks a sample of people where they were living on the day of the census and matches their information to census results.
Coverage Error for the National Population
The results of DA and the PES, together with the 2020 Census, provide a comprehensive, national picture of coverage patterns in the 2020 Census.
The PES estimated a net coverage error rate for the national count of -0.24% (0.25% standard error) or -782,000 (821,000 standard error) people (Table 1). The standard error is a measure of uncertainty in the PES estimates due to sampling.
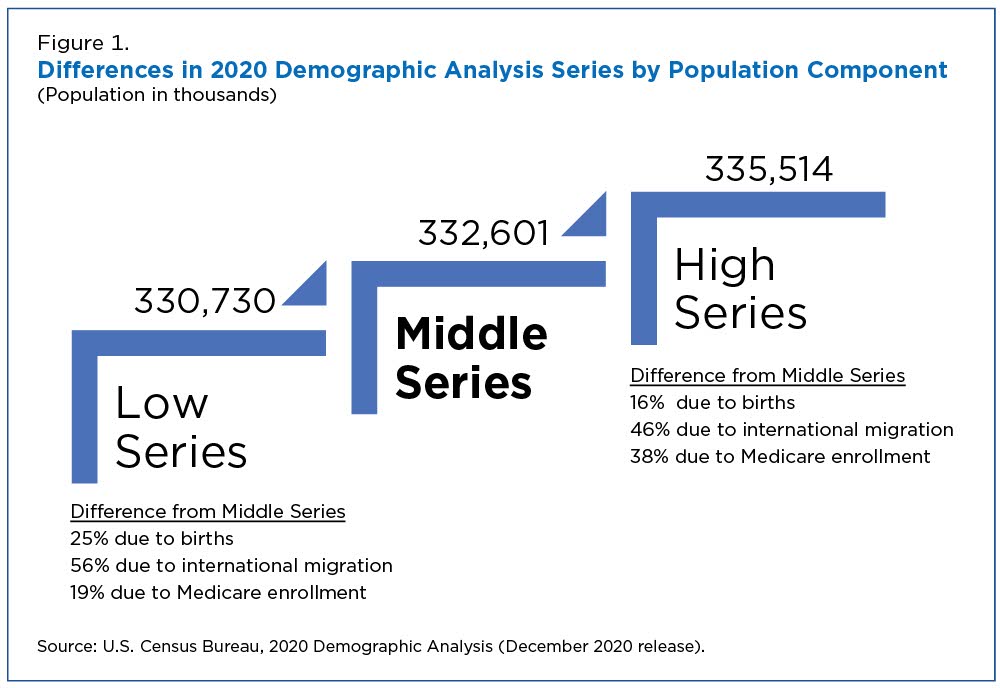
We do not produce standard errors for the DA results but show a range — Low, Middle, High — of estimates. We produced this range by varying the level of historical births, international migration, and enrollment in Medicare across the three series.
International migration accounts for the largest differences between the series, followed by Medicare enrollment and historical births (Figure 1).
Depending on the series, the DA results show both an undercount and overcount nationally.
- The DA net coverage error estimate was 0.22% (a slight overcount) for the Low Series, which includes less international migration, less population in the oldest ages, and fewer historical births than the other series.
- The net coverage error estimate for the Middle Series is -0.35% (a slight undercount).
- The High Series, which has higher international migration, more population in the oldest ages, and more historical births, shows a net coverage error of -1.21%.
As seen in Table 1, the results for the national population in the 2020 Census were similar to the 2010 Census where we did not see a statistically significant overcount or undercount in the PES results and the DA range included both undercounts and overcounts.
However, more variation in the coverage patterns for the 2020 Census becomes evident when we look at the results by demographic characteristics, housing tenure and components of coverage.
PES Results
The PES net coverage error estimates are produced using a statistical technique called dual-system estimation.
Using this technique, the PES interviews a sample of the household population, excluding Remote Alaska areas and the group quarters population. We then match the information to the 2020 Census.
The estimates released today are the first to come from the PES program for the 2020 Census. They include national-level coverage estimates that are broken down by demographic characteristics, housing tenure (own vs. rent), relationship to householder, and the components of census coverage.
This America Counts story focuses on the PES results by age, sex, race, Hispanic origin and housing tenure. However, all the PES results in this first release are available in a report.
Race and Hispanic Origin
The PES survey included the same questions on race and Hispanic origin as the 2020 Census questionnaire.
Table 2 shows the PES net coverage error rates by race and Hispanic origin. Except for the category “Non-Hispanic White alone,” we defined race groups as “alone or in combination with other groups.” Hispanics or Latinos can be of any race.
The PES estimated statistically significant undercounts for the Black or African American alone or in combination, American Indian or Alaska Native alone or in combination, Some Other Race alone or in combination, and Hispanic or Latino populations.
The PES also found statistically significant overcounts for the White alone or in combination, Non-Hispanic White Alone, and Asian alone or in combination populations.
Coverage by Tenure (Owner, Renter)
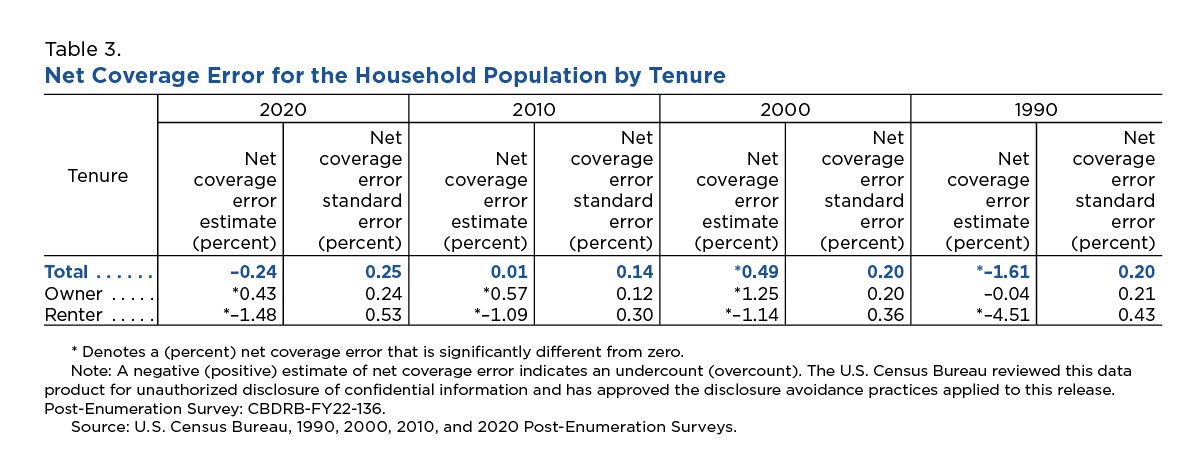
The PES measures coverage by housing tenure — whether the respondents own or rent the housing unit where they live — and it showed that the 2020 Census undercounted renters and overcounted owners. This pattern was seen in previous censuses.
DA Results
The DA program uses current and historical birth and death records, data on international migration and Medicare enrollment records to produce estimates of everyone living in the United States on April 1, 2020.
The estimates are completely independent of the 2020 Census results, which allows us to use them as a benchmark for measuring coverage in the census.
The 2020 DA population estimates were released on December 15, 2020, four months before the first results from the 2020 Census were released on April 26, 2021.
In addition, all the data used for the 2020 DA estimates were produced before April 1, 2020 and are, therefore, unaffected by the COVID-19 pandemic.
However, the December 2020 release did not include estimates of net coverage error because we needed the census results to calculate those.
Even now, the 2020 Census results by detailed age and sex have not been released, but the Census Bureau produced a special tabulation of the 2020 Census with confidentiality protections applied using the 2020 Census Disclosure Avoidance System by age and sex for this release.
Single Year of Age
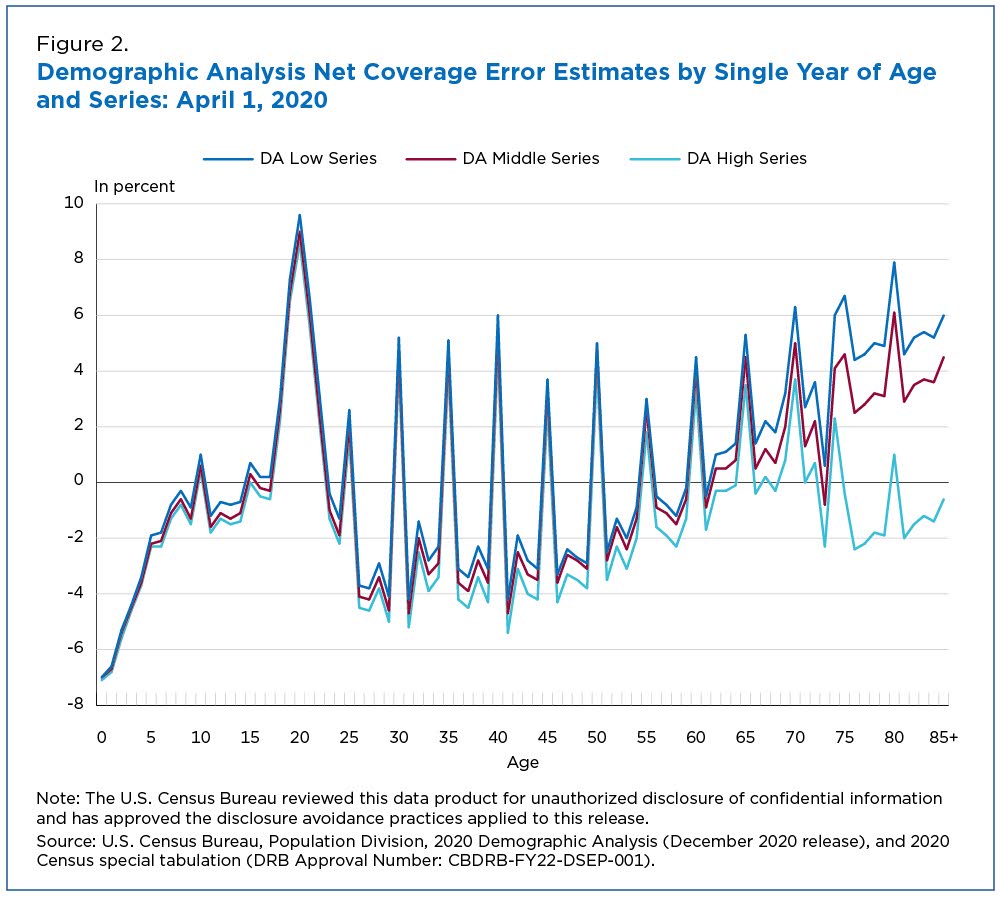
There is considerable variation by single year of age in the DA net coverage error estimates (Figure 2):
- Young children were undercounted more than any other ages.
- Other children, except for ages 10 and 15, were also undercounted.
- The largest overcount was for the population age 20.
- We see both undercounts and overcounts for adults between the ages of 18 and 64.
- The oldest ages show large overcounts in the Low and Middle series and undercounts in the High series.
- There was significant age heaping (explained below) in the 2020 Census results.
There is a lot of variation across the DA series for the oldest ages where the net coverage error estimates show large overcounts in the Low and Middle series and undercounts in the High Series.
The estimates for the age 75-and-older group are unique because we use Medicare enrollment records and not birth records to produce the population estimates (see the DA methodology statement for details on why this is).
The range for these older age groups was produced by making adjustments to the Medicare records to account for under-enrollment.
We see large overcounts for certain ages and large undercounts for the surrounding ages. This pattern is caused by “age heaping” in the 2020 Census results.
Age heaping refers to distortions in the age distribution of a population where the number of ages reported that end in 0 and 5 (e.g., 20, 25, 30, 35…) is higher than would be expected.
Age heaping often happens when people are reporting for someone else — either another member of their household, or a neighbor giving a proxy response.
Think about it this way: If you don’t know exactly how old someone is, you are more likely to guess rounded numbers like 45 or 50 than 46 or 49.
Age and Sex
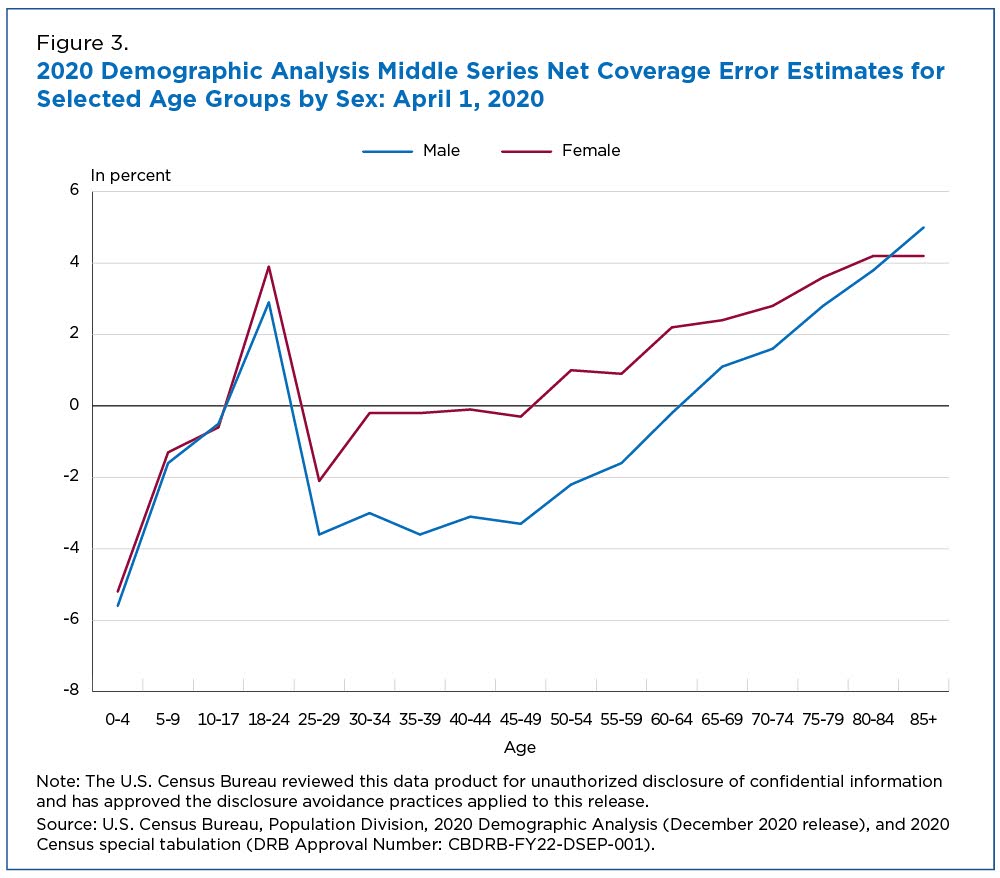
We also released the DA net coverage error estimates for selected age groups by sex.
To simplify, only the results from the Middle Series are described here (Figure 3):
- Young children ages 0-4 have the largest undercount of any age group.
- The DA results show that the population ages 18-24 was overcounted.
- The adult male population ages 25-59 was undercounted, while females in this age range had net coverage error estimates close to zero — an indication of full coverage — or even overcounts.
- The results indicate large overcounts for the retirement ages and the oldest age groups. The overcounts are larger for females than for males, except for the ages 85 and older.
Combined DA and PES Results by Age and Sex
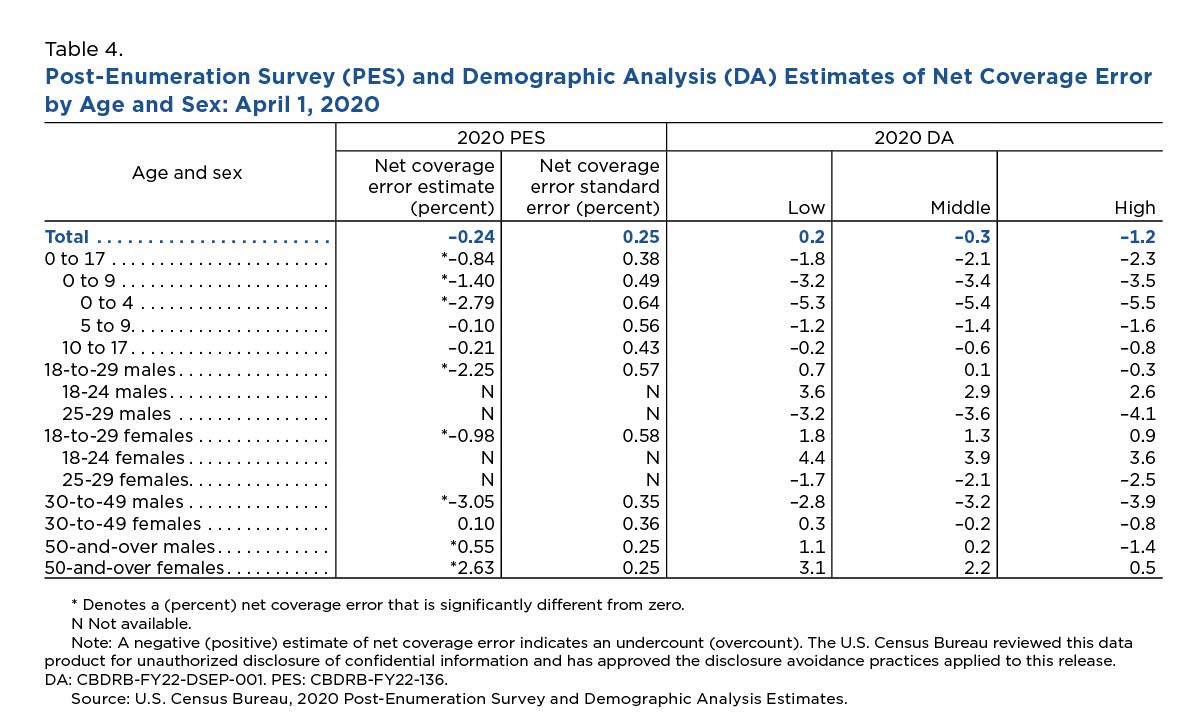
The results shown above focused on the estimates from these programs separately but results by age and sex can be examined together.
Overall, the PES and DA results show similar coverage patterns by age and sex for the 2020 Census, although there are some differences.
For children ages 0-17, we see a statistically significant undercount in the PES results. DA also shows an undercount for this population.
We see similar results for the ages 0-9 and 0-4, where the PES shows a statistically significant undercount, and the DA results also show an undercount. The level of undercount is greater for the DA estimates, which is due to differences in methodology.
A major contrast that we see between PES and DA results is for males and females ages 18-29. In both categories, the PES shows a statistically significant undercount while the DA estimates show an overcount for these populations, except for the High series for males. For these ages, the difference is that the High series assumes more international migration than the other series.
When we break down the DA net coverage error estimates for these males and females even further, we see that there were large overcounts for the 18-24 age group, but undercounts for the 25-29 age group. The PES estimates for these smaller age groups are not available.
The DA estimates are produced for the total population living in the United States on April 1, 2020, while the PES estimates are produced for the household population living in the United States excluding Remote Alaska areas.
A lot of people in the 18-24 age group live in college dorms, which are not part of the PES sample. Research is underway to explore the differences between the DA and PES results for these ages.
The PES and DA estimates of net coverage error for adults ages 30-49 show similar patterns. Males in this age range showed an undercount in DA and a statistically significant undercount in PES.
PES found a statistically significant overcount for both males and females 50 years and older but the net coverage error estimate for females was larger than for males.
We see similar results for DA where, except for the High series for males, the net coverage error estimates show an overcount.
What Happens Next?
Today we released the first official results from the PES program and the most detailed estimates to date from DA of coverage in the 2020 Census. Although the two coverage programs use different methodologies, the overall results from PES and DA are similar.
While examining the total population, we find an overcount using the Low DA series, which includes less international migration, fewer people in the oldest ages, and fewer historical births. For the other DA series, the net coverage error estimate is -0.35 and -1.21 implying an undercount.
The PES estimate for the total population is not statistically significantly different from zero while the DA estimates range from 0.22 to -1.21. However, the results do point to coverage issues for some population groups.
Both PES and DA will release additional estimates of coverage for the 2020 Census. Later this year, we will release the PES estimates for housing units as well as estimates for states and Puerto Rico. The DA estimates will be released by race and Hispanic origin.
Once these additional estimates are released, we will have an even better understanding of coverage in the 2020 Census.
The findings from PES and DA provide valuable insights to help us plan for the 2030 Census. In addition, the Population Estimates Program is already using the results from DA to adjust the estimates base for the early part of the decade.
Related Statistics
-
Multiracial Heritage Week: June 7-14, 2023The 2020 Census shows the U.S. “Two or More Races” population at 33.8 million — up from 9 million in 2010, a 276% increase.
-
Stats for StoriesNational Child's Day: November 20, 2023In 2021, the majority (71%) of America’s 72.3M children under 18 lived with two parents and the next largest share (20.9%) lived with their mothers only.
Subscribe
Our email newsletter is sent out on the day we publish a story. Get an alert directly in your inbox to read, share and blog about our newest stories.
Contact our Public Information Office for media inquiries or interviews.
-
America Counts StoryDespite Efforts, Census Undercount of Young Children PersistsMarch 10, 2022Improving data for young children in all Census Bureau products is the focus of a new cross-directorate working group.
-
America Counts StoryImproved Race, Ethnicity Measures Show U.S. is More MultiracialAugust 12, 2021Today’s release of 2020 Census data provides a new snapshot of the racial and ethnic composition of the country.
-
America Counts Story2020 U.S. Population More Racially, Ethnically Diverse Than in 2010August 12, 20212020 Census results released today allow us to measure the nation’s racial and ethnic diversity and how it varies at different geographic levels.
-
America Counts StoryAdult Population Grew Faster Than Total Population From 2010 to 2020August 12, 2021The first detailed results of the 2020 Census released today show a nationwide shift in the age makeup of the U.S. population from 2010 to 2020.
-
HousingHow the Nation’s Housing Changed in 20 YearsSeptember 16, 2025Twenty years of American Community Survey data show higher housing costs for renters and a smaller share of homeowners with mortgages.
-
HousingRecent Homebuyers Face Highest Mortgage Payments in Nearly Two DecadesSeptember 11, 2025Despite higher median monthly mortgage payments, homeowners who moved in 2024 lived in homes with lower median values than those who moved in 2021.
-
HealthUninsured Rates Up in 18 States and District of ColumbiaSeptember 11, 2025The percentage of people with Medicaid coverage dropped in 30 states, contributing to a rise in the uninsured rate from 2023 to 2024.
-
HousingNearly a Quarter of Homeowners Paid Condo or HOA Fees in 2024September 11, 2025New data show that about 5.5 million households paid less than $50 a month and 3 million over $500 in condo or homeowners association fees in 2024.

