Poverty Measure That Includes Government Assistance Increased to 12.4% in 2022, When Pandemic Relief Ended
The Supplemental Poverty Measure (SPM), which includes government assistance, increased to 12.4% in 2022 from 7.8% in 2021, according to U.S. Census Bureau data released today. The 2022 poverty rate was also 0.6 percentage points higher than the pre-pandemic rate of 11.8% in 2019.
This was the first increase in the overall SPM rate since 2010. The increase was largely the result of the end of stimulus payments and tax credits in effect during the COVID-19 pandemic that had lowered the SPM rate to its lowest level ever in 2021. The changes had a particularly pronounced impact on the poverty rates of children.
In 2022, 78.4 million people in the United States were in poverty using a measure of resources that included only money income net of necessary nontax expenses. This number declined by 29.5 million to 48.9 million people in poverty when social insurance programs were added to resources.
Government Assistance and Taxes Impact Poverty Rates
Every year, the Census Bureau releases two poverty measures: the official poverty measure and the SPM.
The official poverty measure defines poverty by comparing pretax money income to a poverty threshold adjusted by family size, number of children and age of householder.
The SPM expands this definition by including income and payroll taxes, tax credits and other noncash benefits like Supplemental Nutritional Assistance Program (SNAP) and housing subsidies. Necessary expenses such as child support paid, child care and medical expenses are deducted.
The SPM can be split into four components:
- Market income minus nontax expenses (wages and earnings less medical and work expenses and child support paid).
- Social insurance (Social Security, Supplemental Security Income, unemployment insurance, workers' compensation and other public assistance).
- Noncash benefits (SNAP, Special Supplemental Nutrition for Women, Infants, and Children, the National School Lunch Program, utility assistance and housing assistance).
- Taxes and credits (state and federal income taxes, payroll taxes, and tax credits).
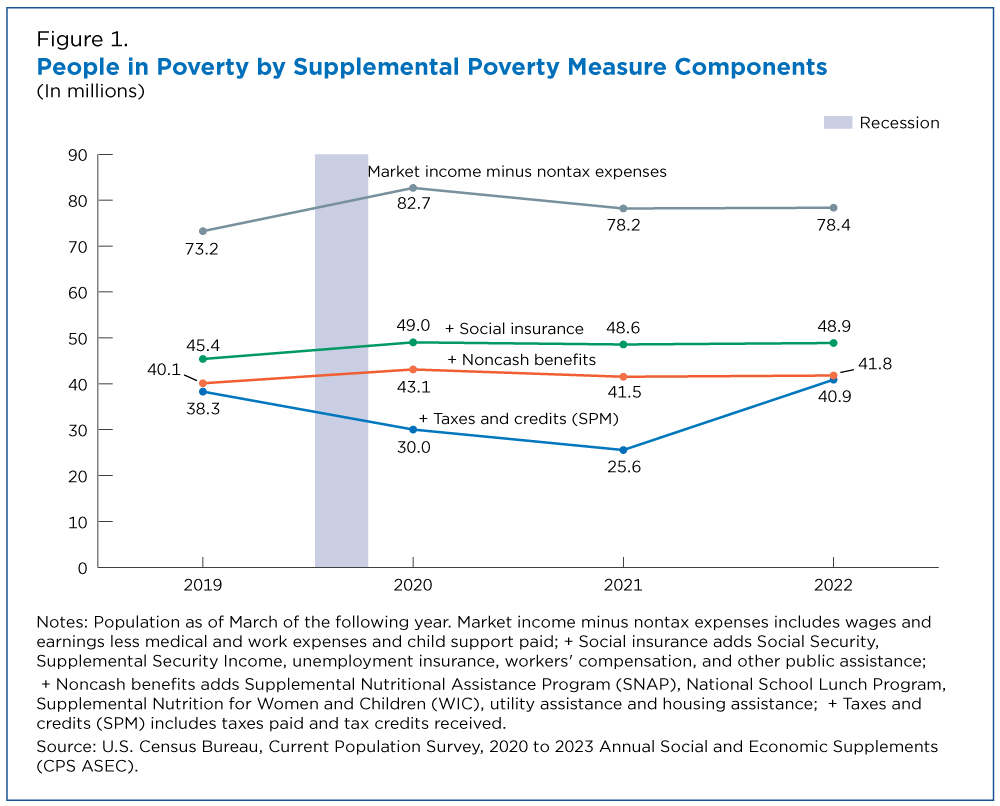
Figure 1 highlights the importance of each of these components between 2019 (the last data year prior to the pandemic) and 2022.
The figure starts with the grey line above the others that shows the number of people in poverty when only accounting for pretax/transfer market income minus medical and work expenses and child support paid. Each following line is cumulative of the line above and incorporates the additional income components listed above (for example, “Social insurance” includes both pretax/transfer market income and social insurance income, while “Noncash benefits” includes both components as well as noncash benefits).
For this exercise, poverty thresholds and resource-sharing units are unchanged across measures, only resource components change across lines.
In 2022, 78.4 million people in the United States were in poverty using a measure of resources that included only money income net of necessary nontax expenses. This number declined by 29.5 million to 48.9 million people in poverty when social insurance programs were added to resources. This decline was greater than in 2019, when social insurance programs removed 27.8 million people from poverty.
The addition of noncash benefits like SNAP lifted another 7.1 million people out of poverty (1.8 million more than in 2019), leaving 41.8 million people in poverty in 2022 once all benefits (not including taxes) were considered.
Finally, 40.9 million people were in SPM poverty once taxes paid and tax credits received were included in resources.
In 2019, before the pandemic, the inclusion of taxes paid and tax credits had a net impact of removing approximately 1.8 million people from poverty, compared with 910,000 people in 2022. In comparison, the tax system (which included stimulus payments and expanded refundable tax credits) in 2020 and 2021 decreased the number of people in poverty by 13.1 million and 16.0 million people respectively.
Changes in Tax Policy Affected Children in Poverty
The COVID-19 pandemic brought about many tax policy changes especially for families with children.
Three rounds of stimulus payments were distributed in 2020 and 2021 and changes to the refundable portion of the Child Tax Credit and Earned Income Tax Credit meant that families with children were eligible to receive larger benefits in 2020 and 2021 compared to other years.
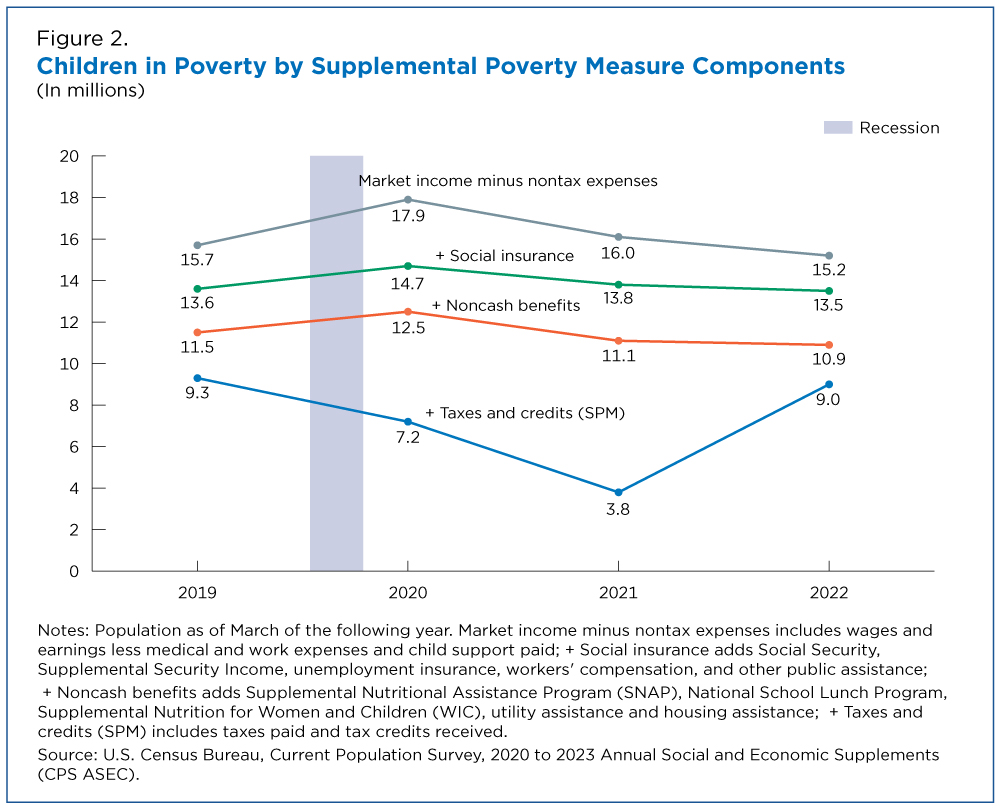
Figure 2 shows how these changes affected the number of children in poverty between 2019 and 2022.
Between 2019 and 2020, the impact of tax policy in response to the COVID-19 pandemic led to a decline in SPM child poverty even with the short recession in spring 2020. This was in large part due to the two rounds of stimulus payments that families received as part of pandemic relief.
In 2021, poverty fell for each SPM component measure, reflecting improvements in economic conditions as the COVID-19 pandemic continued. The tax system, which included expansions to refundable tax credits and a third round of the stimulus payments removed 7.3 million children from poverty.
The expansions of refundable tax credits and the stimulus payments expired in 2022, meaning families with children received fewer resources from tax credits. As a result, the number of children in poverty using the full SPM increased by over 5.0 million children from 2021.
The report, Poverty in the United States: 2022, provides more details on the impacts of policies and programs on the SPM rate.
The technical documentation page includes Information on confidentiality protection, methodology, sampling and nonsampling error, and definitions. All comparative statements have undergone statistical testing and are statistically significant at the 90 percent confidence level unless otherwise noted.
Related Statistics
-
Stats for StoriesNational Poverty in America Awareness Month: January 2025The Current Population Survey Annual Social and Economic Supplement reports the official poverty rate in 2023 was 11.1%, not statistically different from 2022.
-
Current Population Survey (CPS)The CPS is a monthly survey sponsored by the Bureau of Labor Statistics and conducted by the U.S. Census Bureau.
-
America Counts: Stories About Supplemental Poverty MeasureExplore various America Counts stories on the topic of supplemental poverty measure.
-
Supplemental Poverty MeasureIn 2009, the Census Bureau and Bureau of Labor Statistics (BLS) created a Supplemental Poverty Measure (SPM) to replace previous experimental poverty measures.
Subscribe
Our email newsletter is sent out on the day we publish a story. Get an alert directly in your inbox to read, share and blog about our newest stories.
Contact our Public Information Office for media inquiries or interviews.
-
Income and PovertyMedian Household Income After Taxes Fell 8.8% in 2022September 12, 2023The expiration of expansions to federal programs during COVID-19 resulted in lower post-tax household income and higher poverty rates.
-
Income and PovertyBlack Individuals Had Record Low Official Poverty Rate in 2022September 12, 2023New U.S. Census Bureau data show the official poverty rate for Black individuals and Black children hit record lows in 2022.
-
Income and Poverty2022 Income Inequality Decreased for First Time Since 2007September 12, 2023U.S. Census Bureau income data released today show declines in real income at the middle and top of the income distribution from 2021 to 2022.
-
HealthHealth Insurance Coverage of U.S. Workers Increased in 2022September 12, 2023Health insurance coverage for working-age adults ages 19 to 64 improved in 2022 across race groups and Hispanic origin and in most regions.
-
EmploymentThe Stories Behind Census Numbers in 2025December 22, 2025A year-end review of America Counts stories on everything from families and housing to business and income.
-
Families and Living ArrangementsMore First-Time Moms Live With an Unmarried PartnerDecember 16, 2025About a quarter of all first-time mothers were cohabiting at the time of childbirth in the early 2020s. College-educated moms were more likely to be married.
-
Business and EconomyState Governments Parlay Sports Betting Into Tax WindfallDecember 10, 2025Total state-level sports betting tax revenues has increased 382% since the third quarter of 2021, when data collection began.
-
EmploymentU.S. Workforce is Aging, Especially in Some FirmsDecember 02, 2025Firms in sectors like utilities and manufacturing and states like Maine are more likely to have a high share of workers over age 55.


