Income Inequality Down Due to Drops in Real Incomes at the Middle and Top, But Post-Tax Income Estimates Tell a Different Story
Income inequality declined in 2022 for the first time since 2007, due primarily to declines in real median household income at middle and top income brackets, according to the Income in the United States: 2022 report released today.
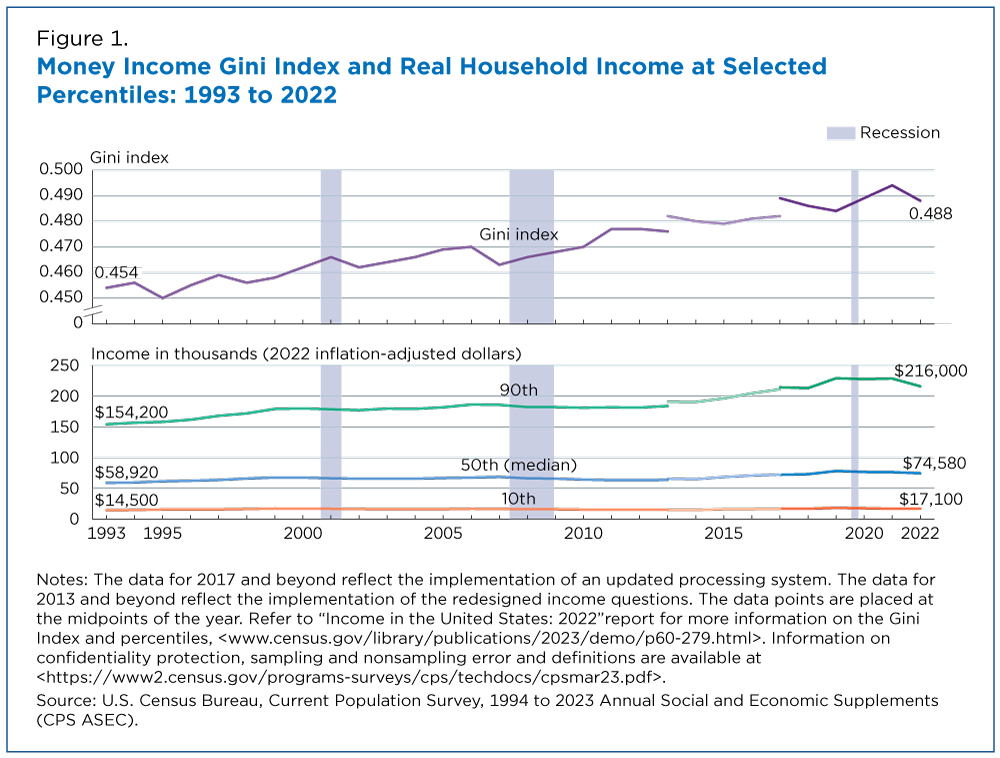
The report shows real median household income dropped 2.3% to $74,580 from 2021 to 2022.
Several policies expired in 2022, including Economic Impact Payments and the expanded Child Tax Credit introduced in response to the COVID-19 pandemic, which contributed to the increase in post-tax income inequality at the bottom of the income distribution.
U.S. Census Bureau data from the Current Population Survey Annual Social and Economic Supplement (CPS ASEC) show that the declines in real income at the middle and top of the income distribution resulted in lower income inequality as measured by the Gini index — a common measure of income inequality.
Income inequality refers to how evenly income or income growth is distributed across the population. Higher income inequality represents less equal income distribution or growth.
The report provides several measures of inequality. In this article, we focus on changes in the Gini index and the ratios of income at different percentiles.
The Gini index measures income inequality ranging from 0 to 1 — reflecting the amount that any two incomes differ, on average, relative to mean income.
It is an indicator of how “spread out” incomes are from one another. A value of 0 represents perfect equality, meaning all households had the same amount of income. A value of 1 indicates total inequality, meaning that one household had all the income.
Using pretax money income, the Gini index decreased by 1.2% between 2021 and 2022 (from 0.494 to 0.488). This annual change was the first time the Gini index had decreased since 2007, reversing the 1.2% increase between 2020 and 2021 (Figure 1).
Since 1993 — the earliest year available for comparable measures of income inequality — the Gini index has increased 7.6%.
What Drives Income Inequality
A decrease in the Gini index indicates that the distribution of income has become more equal. However, this indicator does not offer insight into how income inequality decreased.
The median represents the midpoint (50th percentile) of the income distribution. Comparing how incomes changed at different points along the income distribution can tell us what is driving income inequality.
The 2022 data suggest that declines in real income at the middle and top of the income distribution drove the decrease in the Gini index.
At the 90th percentile, 10% of households in 2022 had income above $216,000, down 5.5% from the 2021 estimate of $228,600.
However, at the 10th percentile, 10% of households had income at or below $17,100 in 2022, not statistically different from 2021 ($16,890).
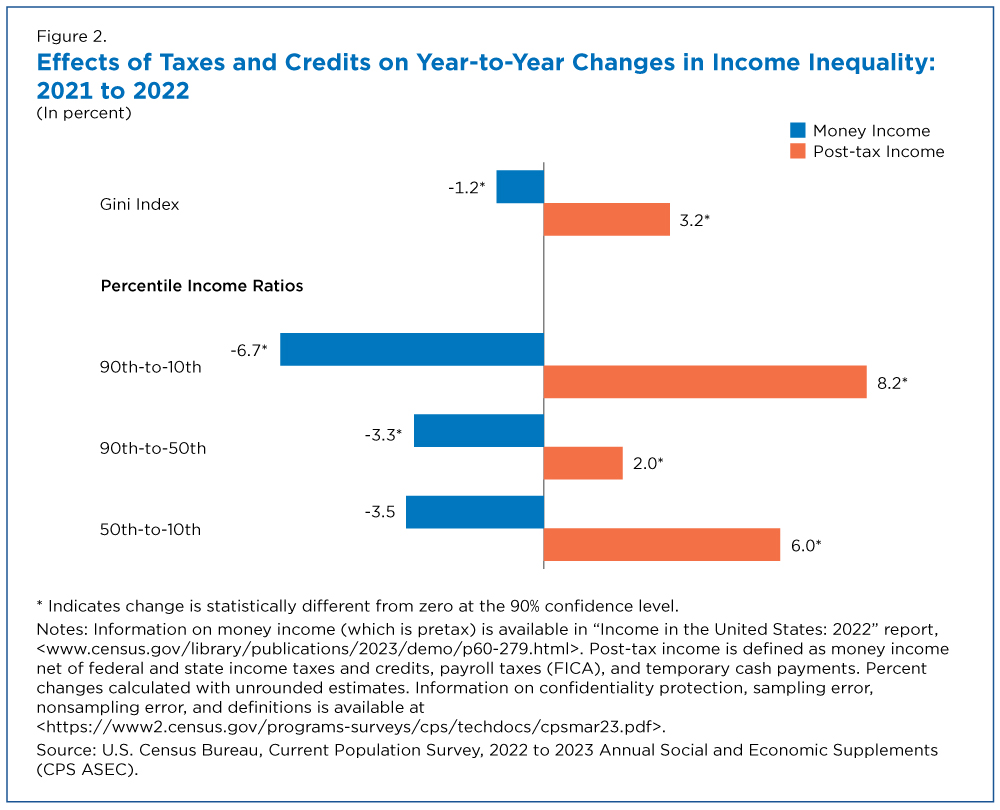
The ratio of the 90th- to 10th-percentile (inequality between the top and bottom of the income distribution) decreased from 13.53 in 2021 to 12.63 in 2022. That means income at the top of the income distribution was 12.63 times higher than income at the bottom, a 6.7% decrease from 2021.
The ratio of the 90th- to 50th-percentile (inequality between the top and middle of the income distribution) also decreased — down 3.3% from 2.99 in 2021 to 2.90 in 2022.
The ratio of the 50th- to 10th-percentile (inequality between the middle and bottom of the income distribution) was not significantly different over this period, further indication that the lower end of the income distribution did not drive the change in inequality. Refer to the end of the story for notes about significance testing.
Pretax and Post-tax Measures
The Income in the United States: 2022 report also contains an appendix that compares pretax to post-tax income inequality measures.
Post-tax income is defined as money income after federal and state income taxes and credits, payroll taxes (FICA or Federal Insurance Contributions Act) and temporary cash payments administered by tax agencies, like state income tax rebates or stimulus payments.
In contrast to the 1.2% decrease in the Gini index calculated using pretax income, the annual change in the Gini index calculated using post-tax income increased 3.2% from 2021 to 2022. These contrasting findings highlight the importance of definitions in understanding economic well-being.
Using post-tax income, the ratios of the 90th- to 10th-percentile, 90th- to 50th-percentile, and 50th- to 10th-percentile all increased between 2021 and 2022.
As Figure 2 shows, the ratio of the 90th- to 10th-percentile showed the largest post-tax income increase (8.2%), from 8.94 in 2021 to 9.67 in 2022.
Several policies expired in 2022, including Economic Impact Payments and the expanded Child Tax Credit introduced in response to the COVID-19 pandemic, which contributed to the increase in post-tax income inequality at the bottom of the income distribution.
Comparing inequality measures using pretax and post-tax income illustrates the impact the tax system can have on reducing inequality, as well as the importance of definitions in understanding trends in economic well-being and inequality. Using different definitions of income (pretax vs post-tax) will lead to different conclusions about the direction of inequality: pretax income inequality decreased while post-tax income inequality increased from 2021 to 2022.
Appendix B of the Income in the United States: 2022 report contains more information on post-tax income inequality measures. Definitions and information on confidentiality protection, methodology, and sampling and nonsampling error are available in the technical documentation.
All comparisons made here and in the report have been tested and found to be statistically significant at the 90% confidence level, unless otherwise noted. The following differences between the 2021–2022 percent changes in percentile income ratios were not statistically significant: 90th to 10th percentile and 90th to 50th percentile, and 90th to 50th percentile and 50th to 10th percentile.
Related Statistics
-
Stats for StoriesEqual Pay Day: March 12, 2024In 1973, full-time working women earned a median of 56.6 cents to every dollar men earned. In 2022 (49 years later), women earned 84.0, a gain of 27.4 cents.
-
Current Population Survey (CPS)The CPS is a monthly survey sponsored by the Bureau of Labor Statistics and conducted by the U.S. Census Bureau.
-
America Counts: Stories about Income Inequality
-
Income InequalityIncome inequality is the extent to which income is distributed unevenly among a population.
Subscribe
Our email newsletter is sent out on the day we publish a story. Get an alert directly in your inbox to read, share and blog about our newest stories.
Contact our Public Information Office for media inquiries or interviews.
-
Income and PovertyMedian Household Income After Taxes Fell 8.8% in 2022September 12, 2023The expiration of expansions to federal programs during COVID-19 resulted in lower post-tax household income and higher poverty rates.
-
Income and PovertyBlack Individuals Had Record Low Official Poverty Rate in 2022September 12, 2023New U.S. Census Bureau data show the official poverty rate for Black individuals and Black children hit record lows in 2022.
-
HealthHealth Insurance Coverage of U.S. Workers Increased in 2022September 12, 2023Health insurance coverage for working-age adults ages 19 to 64 improved in 2022 across race groups and Hispanic origin and in most regions.
-
Income and PovertySupplemental Poverty Measure in 2022 Higher Than Pre-Pandemic LevelSeptember 12, 2023The Supplemental Poverty Measure (SPM) that accounts for government assistance increased from 7.8% in 2021 to 12.4% in 2022.
-
GovernmentWho Manages the Nation’s Airports?December 10, 2024We link two sets of data from the 2022 Census of Governments: the number of airport authorities and air transportation financial data.
-
PopulationPopulation Trends Across the GlobeNovember 26, 2024The Census Bureau’s released updated population estimates and projections for 34 countries that reveal population shifts.
-
Business and EconomyMost U.S. Businesses Have Only One OwnerNovember 21, 2024More than half of U.S. businesses had one owner from 2017 to 2021 and women-owned were more likely than male-owned businesses to have a single owner.
-
EmploymentEffects of the COVID-19 Pandemic on Private and Public EmploymentNovember 20, 2024Private employment dropped by a smaller percentage and rebounded, surpassing pre-pandemic levels. State and local government employment has not fully recovered.


