Public and Private Preschool Enrollment From 2019 to 2021 at Its Lowest Since 2005
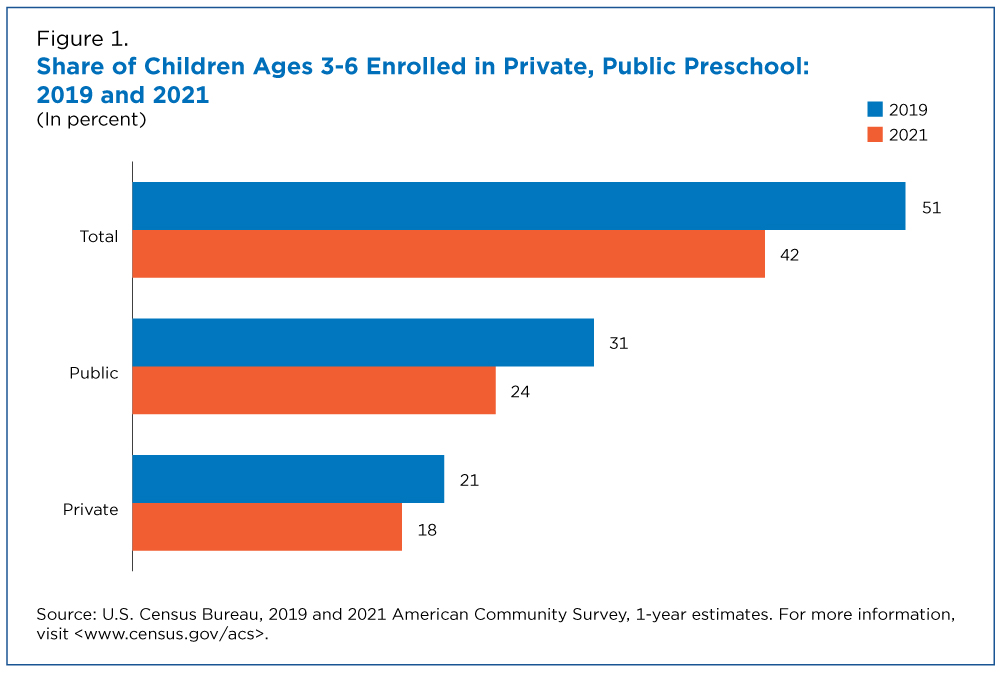
The percentage of 3-to-6-year-olds enrolled in preschool in the United States dropped by 9.3 percentage points from 2019 to 2021, from 51.1% to 41.8%, according to a new U.S. Census Bureau report.
The rate of total preschool enrollment for 3- to 6-year-olds fell in both private and public schools but the rates of decline varied.
The 4.1 million preschool enrollees in 2021 was the smallest number since the American Community Survey (ACS) began collecting these data in 2005. This decline coincides with the COVID-19 pandemic emergency. Many schools closed because of public health and safety concerns. In addition, there was a general unwillingness to send children to school at the height of the pandemic.
The rate of total preschool enrollment for 3- to 6-year-olds fell in both private and public schools but the rates of decline varied.
Public school enrollment shrank by 6.5 percentage points (30.5% to 24.0%) and private school enrollment by 2.8 points (20.6% to 17.8%).
Geographic Change
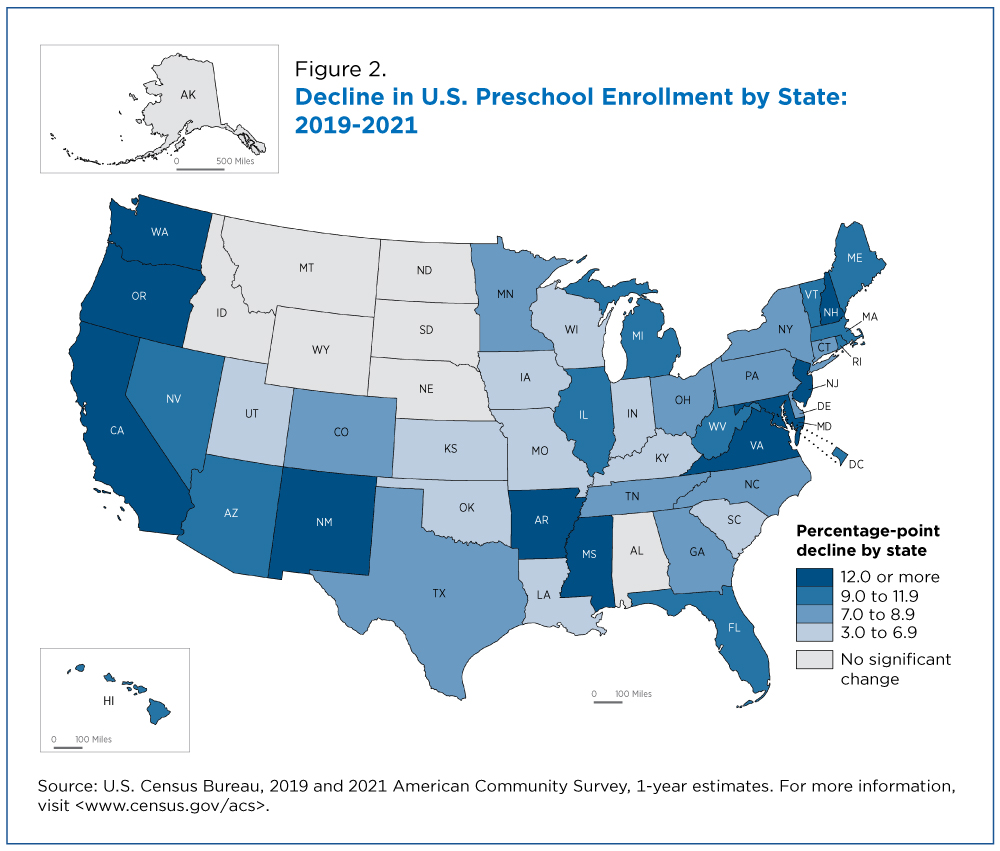
The drop in preschool enrollment was felt across the nation. From 2019 to 2021, 42 states and the District of Columbia had statistically significant declines in preschool enrollment. Eight experienced no significant change (Figure 2).
State-level percentage declines in preschool enrollment ranged from 3.6 points in Indiana to 19.0 points in New Hampshire.
Large percentage declines occurred along both coasts, with sizeable and significant drops in California (13.9 points), New Jersey (13.9 points), Maryland (13.8 points), Oregon (13.3 points) and Washington (13.3 points).
States with nonsignificant changes were largely concentrated in the upper Midwest (Nebraska, North Dakota and South Dakota) and Western region (Alaska, Montana, Idaho and Wyoming).
Decline in Enrollment Vary by Race and Hispanic Origin
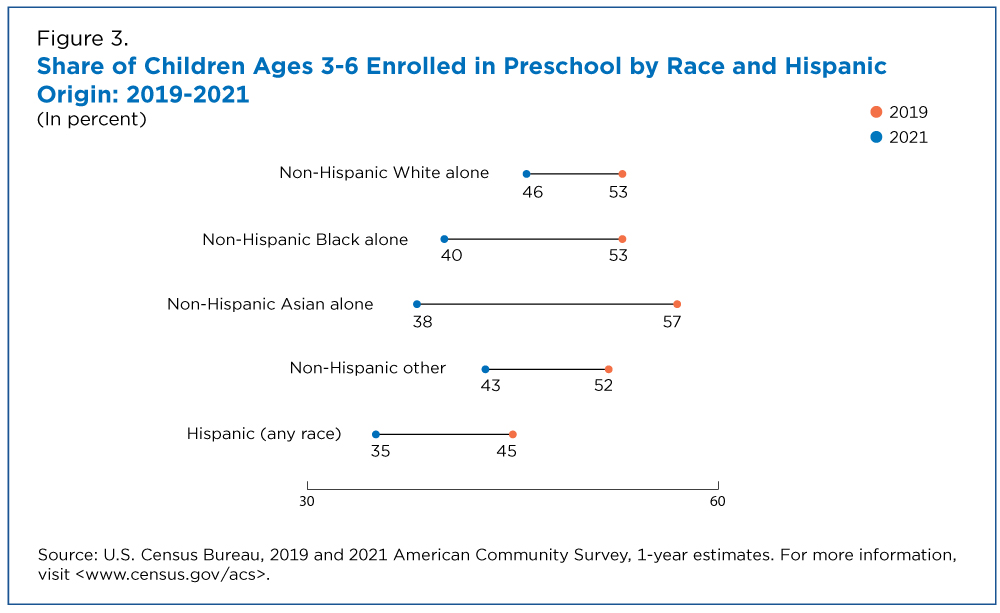
Declines in preschool enrollment varied across race and Hispanic origin groups (Figure 3):
- The share of children who were Asian alone (non-Hispanic) enrolled in preschool declined from 56.7% in 2019 to 38.1% in 2021, an 18.6-point drop and the largest of any other group. This was an especially significant shift since Asian preschool enrollment was the highest of any racial or ethnic group in 2019.
- Black (non-Hispanic) children had a slightly smaller decline in the same period, from 53.0% to 39.6% (down 13.4 points).
- Enrollment for White (non-Hispanic) children declined from 53.2% to 46.0% (down 7.2 points).
- Some Other Race (includes those identifying as American Indians and Alaskan Natives, Native Hawaiian or Pacific Islanders, Two or More Races and any other race not specified in the table) declined from 52.0% to 43.4% (down 8.6 points).
- Hispanic or Latino preschool enrollment went from 44.6% to 35.0% (down 9.6 points).
Work and Families
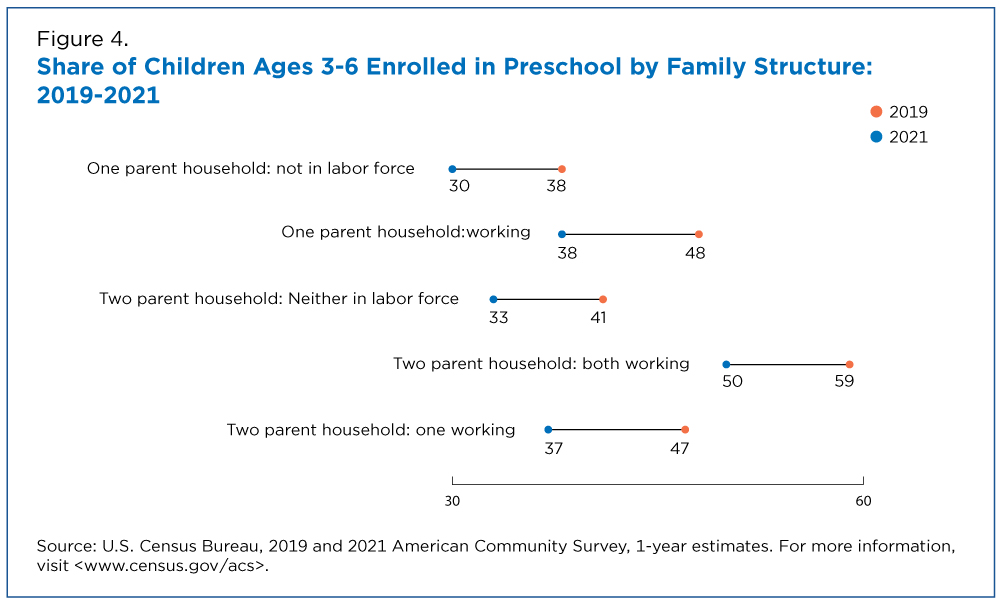
Preschool enrollment declined for all families (between 7.2 and 9.8 percentage points) but varied by family structure and parental work status (Figure 4):
- The percentage of children enrolled in preschool and living with two working parents declined from 58.6% to 50.0% (down 8.6 points), the highest enrollment rate of any group in Figure 3 in either year. Even with the declines, the 2021 preschool enrollment rate for households with both parents working was higher than any of the 2019 rates for the other groups.
- Children living in a one parent household with a working parent had the next highest enrollment rate in 2019 and 2021 but that rate declined as well, from 47.8% in 2019 to 38.2% in 2021 (down 9.6 points).
- Preschool enrollment rates for the next largest group — children living in two parent households with one parent working — declined from 46.9% to 37.1% (down 9.8 points).
- Enrollment for children living with both parents, neither of whom was in the labor force, declined from 41.4% to 33.3% (down 8.1 points).
- Children living with one parent who was not in the labor force declined from 37.6% to 30.4% (down 7.2 points).
These data show how the COVID-19 pandemic had a significant impact on patterns of early childhood education. Future research will show if this was the start of a long-term trend or if enrollment will bounce back to prior levels.
Related Statistics
-
Stats for StoriesBack to School: August 2023The October 2021 Current Population Survey found 73.8 million total students enrolled in school, which is 23.5 percent of the population 3 years and older.
-
Stats for StoriesNational Kindergarten Day: April 21, 2023The 2021 Current Population Survey found 4.1M children in kindergarten, an increase of 370,000 in one year.
-
Stats for StoriesNational Teacher Appreciation Week and Day: May 8-12 and May 9, 2023The 2021 American Community Survey counted about 5.95M teachers in the U.S. including preschool to postsecondary, special ed, tutors, assistants, and other.
-
American Community Survey (ACS)The American Community Survey is the premier source for information about America's changing population, housing and workforce.
Subscribe
Our email newsletter is sent out on the day we publish a story. Get an alert directly in your inbox to read, share and blog about our newest stories.
Contact our Public Information Office for media inquiries or interviews.
-
EducationPre-COVID Early Childhood Enrollment Grew, More in Public PreschoolsNovember 22, 2021Before COVID-19, preschool enrollment was increasing as state funding of early education programs grew and the federal government is now proposing universal
-
EducationHomeschooling on the Rise During COVID-19 PandemicMarch 22, 2021The U.S. Census Bureau’s Household Pulse Survey shows a substantial increase in homeschooling during COVID-19.
-
Income and PovertyNearly a Third of Parents Spent Child Tax Credit on School ExpensesOctober 26, 2021Census Bureau’s Household Pulse Survey shows that many parents spent the first three Child Tax Credit advance payments on child care or school expenses.
-
Income and PovertyNew Snapshots From the Survey of Income and Program ParticipationApril 21, 2025New Census Bureau product offers mobile-friendly fact sheets on who receives income from various sources.
-
PopulationU.S. Metro Areas Experienced Population Growth Between 2023 and 2024April 17, 2025New Census Bureau population estimates show 88% of U.S. metro areas gained population between 2023 and 2024.
-
Business and EconomyWhat Is the Nonemployer Marine Economy?April 09, 2025Thirty states had nonemployer businesses in marine economy sectors, including six states in the Midwest with receipts totaling nearly $11 billion in 2022.
-
Business and EconomyEconomic Census Geographic Area Statistics Data Now AvailableApril 07, 2025A new data visualization based on the 2022 Economic Census shows the changing business landscape of 19 economic sectors across the United States.


