High-Tech Industries Are Concentrated in Five Coastal Metro Areas
Knowing where high-tech industries are located is crucial for many states and communities because businesses in these industries introduce new products and services, create jobs and drive economic growth.
And now a new experimental U.S. Census Bureau data product — Business Dynamics Statistics of U.S. High Tech Industries (BDS-HT) — provides the first- ever view of the dynamics and geographic distribution of employment and businesses in the high-tech sector.
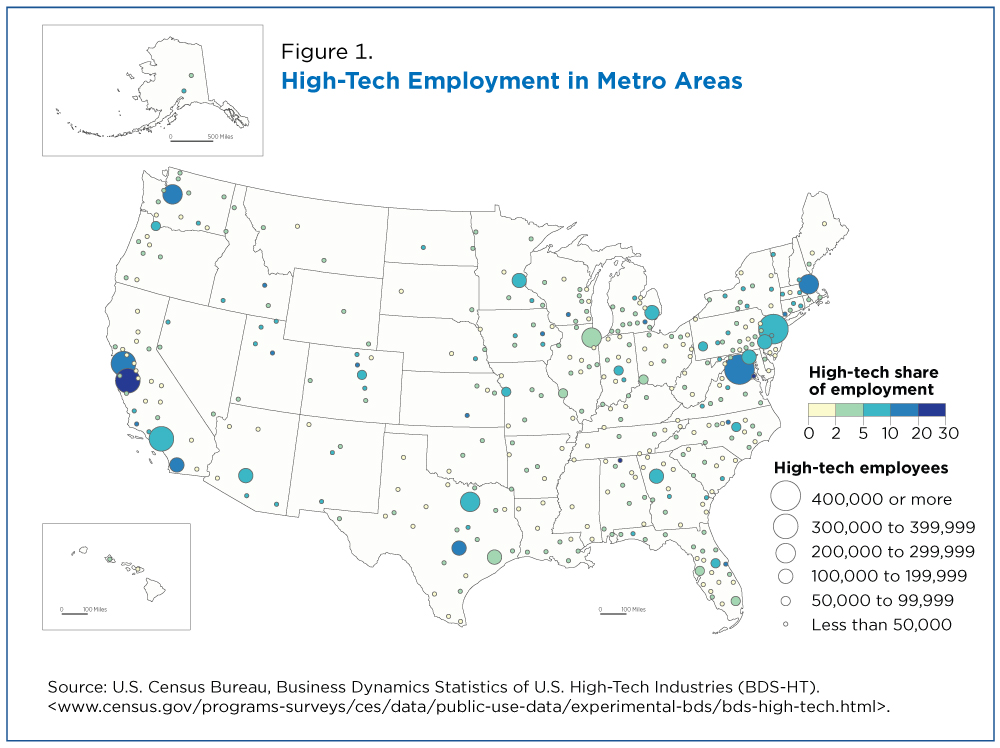
Many MSAs with a significant share of high-tech employment are on the coasts.
These new data provide annual measures of business dynamics for high-tech and non high-tech industries, defined by the concentration of employment in Science, Technology, Engineering, and Math (STEM) occupations. (The BDS-HT methodology page provides additional details on industry classification.)
Figure 1 shows the variation in high-tech sector employment across metropolitan statistical areas (MSAs). Each point on the map conveys:
- Total employment in the high-tech sector. The bigger the dot, the higher the employment.
- The intensity of high-tech employment as a share of total employment. The darker the points, the higher the share.
In short, larger points have more high-tech employment and darker points have a higher share of a metro area’s employment in the high-tech sector.
The metropolitan statistical areas (MSAS) shown in the map account for 94% of high-tech employment, with the remaining 6% in micropolitan and nonmetro areas.
What the Map Shows
Many MSAs with a significant share of high-tech employment are on the coasts.
However, the intensity of high-tech employment varies significantly as it does in San Jose (28%), Washington D.C. (15%), San Francisco (14%), Boston (11%) and New York City (5%).
We are focusing on these five MSAs because they are among the largest in terms of high-tech employment. Next, we explore variation in employment intensity and creation of new high-tech businesses over time.
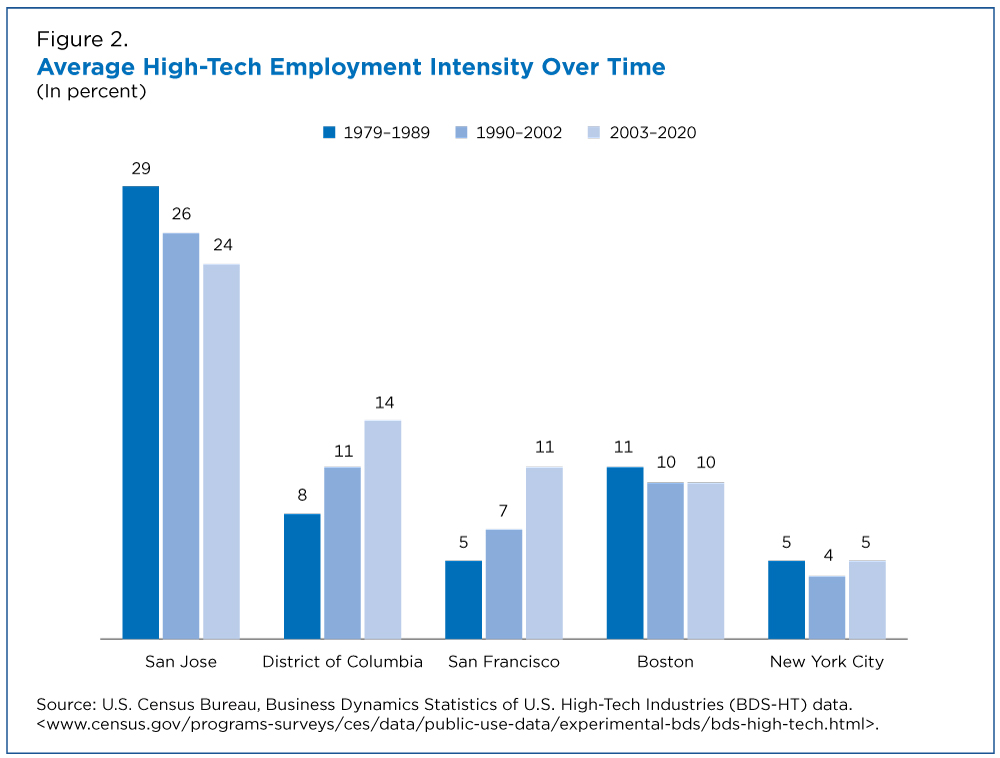
Figure 2 shows that San Jose had a much higher share of employment in high tech than all other MSAs but each of these MSAs exhibited different trends over time.
For example, over 29% of employment in San Jose in the 1980s was in the high-tech sector but the share fell to an average of 24% between 2002 and 2020.
San Jose, Boston (BOS), and New York City (NYC) saw a decrease in high-tech employment intensity since the 1980s. In stark contrast, Washington, D.C. (DC) and San Francisco (SF) saw increases, more than doubling in the case of San Francisco.
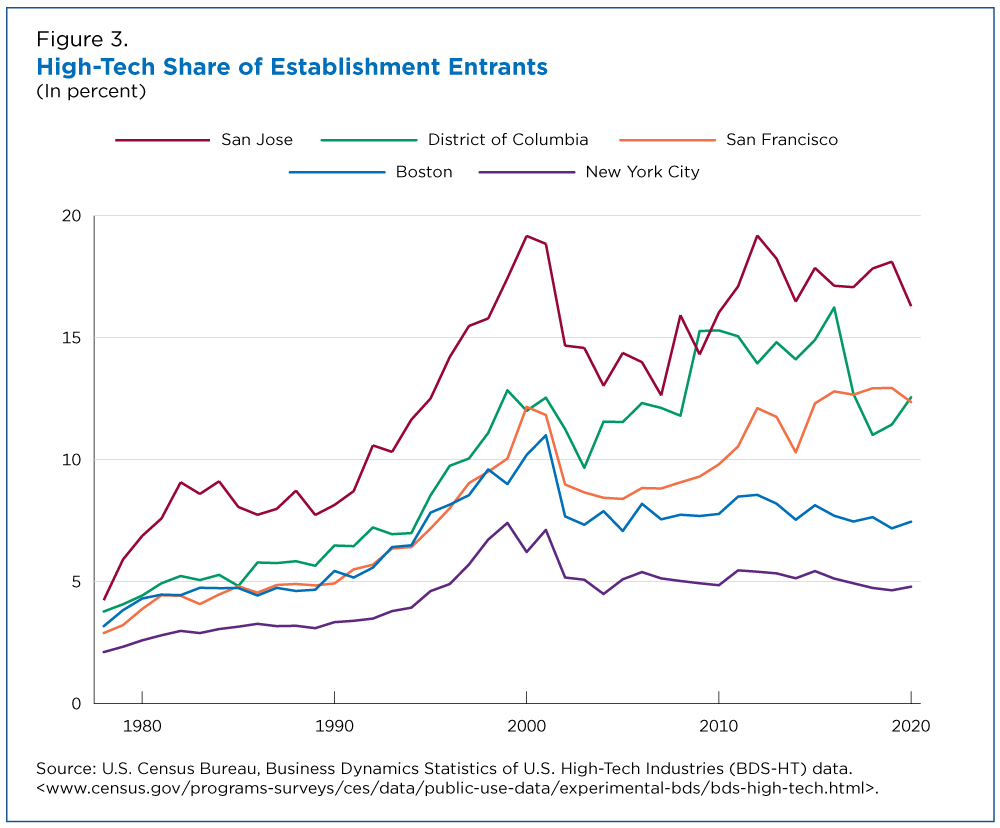
In Figure 3, we can see what share of new establishments in these MSAs were in the high-tech sector.
The share of new businesses in San Jose that were in high tech, for instance, rose from roughly 4% in 1978 to over 16% in 2020, reaching more than 19% in 2000 and 2012.
Washington, D.C., and San Francisco also exhibited consistent increases in the share of new high-tech establishments with the same sharp rise and fall around 2000. The share of new high-tech businesses in Boston and New York City also rose through the early 2000s but then was relatively flat.
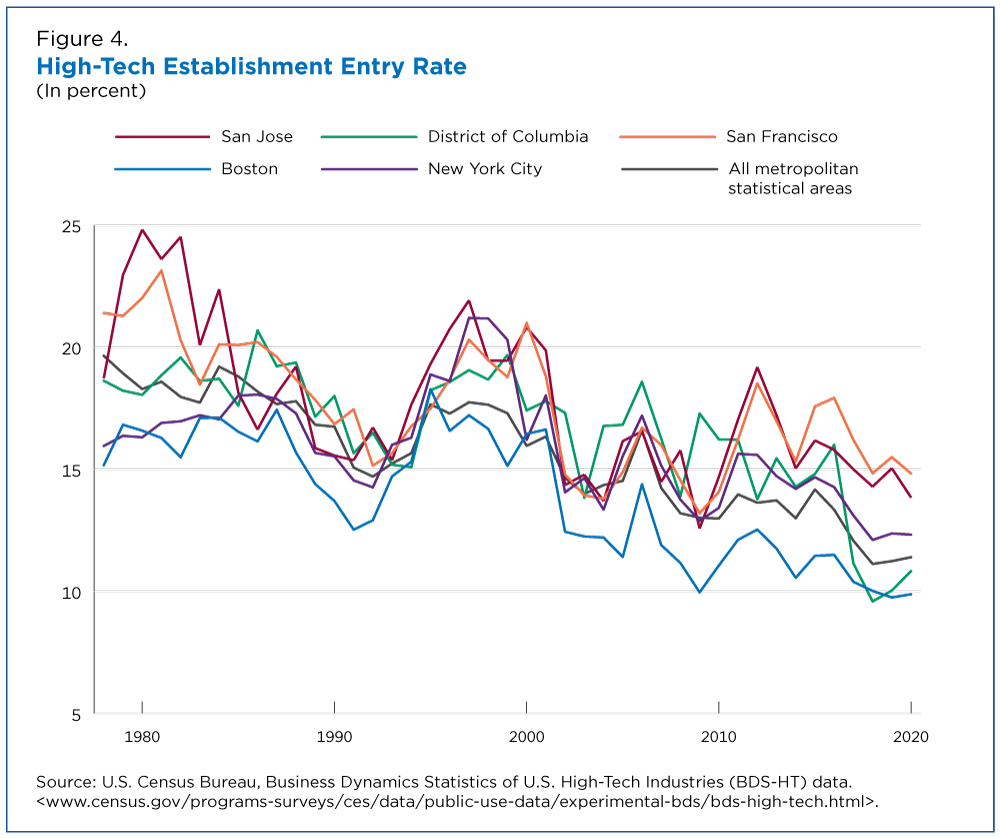
Despite the differences in the share of new establishments in the high-tech sector across these MSAs, we find very similar patterns in the share of all new high-tech businesses in a metro area.
Figure 4 shows the entry rate within the high-tech sector for each of these MSAs. For comparison, we also show the high-tech establishment entry rate for all MSAs.
There was an overall decline aside from the rise in the 1990s. The share of new high-tech establishments decreased and the share of high-tech activity among older establishments increased. Over time, fewer and fewer of the high-tech establishments in these MSAs were newly formed.
These figures demonstrate some of the interesting geographic patterns found in the BDS-HT data. The geographic distribution, shifting intensity and increasing share of incumbent establishments may have consequences for innovation and economic growth. The BDS-HT allow data users to explore the dynamics of high-tech industries across firm and establishment characteristics including size, age, and location of firms.
More information on BDS-HT data and methodology is available on the BDS-HT web page. Send questions and comments to ces.bds@census.gov.
Related Statistics
-
Stats for StoriesNational STEM Day: November 8, 2024The American Community Survey estimates 10.8M Americans 16+ were employed in STEM occupations in 2021, 26.7% women who earned 84.1% as much as men.
-
Stats for StoriesEmployee Appreciation Day: March 1, 2024The American Community Survey estimates that in 2022 there were about 117.0M full-time, year-round civilian workers ages 16 and over in the U.S. and median earn
Subscribe
Our email newsletter is sent out on the day we publish a story. Get an alert directly in your inbox to read, share and blog about our newest stories.
Contact our Public Information Office for media inquiries or interviews.
-
America Counts StoryKnowing Your Job and Earnings Prospects by College and DegreeJune 30, 2022The U.S. Census Bureau Post-Secondary Employment Outcomes tool has expanded to provide earnings prospects for graduates of 660 schools by field of study.
-
America Counts StoryU.S. Startups Create Jobs at Higher Rates, Older Large Firms Employ Most WorkersFebruary 16, 2022The U.S. Census Bureau’s Business Dynamics Statistics show how the age and size of firms contributed to job creation and employment shares from 1976 to 2019.
-
America Counts StoryWomen Making Gains in STEM Occupations but Still UnderrepresentedJanuary 26, 2021While women make up nearly half of the U.S. workforce, they are only 27% of STEM workers, up from 8% in 1970.
-
Income and PovertyNew Snapshots From the Survey of Income and Program ParticipationApril 21, 2025New Census Bureau product offers mobile-friendly fact sheets on who receives income from various sources.
-
PopulationU.S. Metro Areas Experienced Population Growth Between 2023 and 2024April 17, 2025New Census Bureau population estimates show 88% of U.S. metro areas gained population between 2023 and 2024.
-
Business and EconomyWhat Is the Nonemployer Marine Economy?April 09, 2025Thirty states had nonemployer businesses in marine economy sectors, including six states in the Midwest with receipts totaling nearly $11 billion in 2022.
-
Business and EconomyEconomic Census Geographic Area Statistics Data Now AvailableApril 07, 2025A new data visualization based on the 2022 Economic Census shows the changing business landscape of 19 economic sectors across the United States.


