Quarterly Workforce Indicators Show Youth Summer Employment Has Fallen Over the Last Few Decades
Young workers were once a consistently growing source of summer labor, but sharp declines coinciding with economic downturns have pushed third quarter youth employment to its lowest level in at least 28 years and the Bureau of Labor Statistics (BLS) expects this trend to continue.
Historically, workers ages 14-18 have been much more likely to be employed at the beginning of the third quarter (July 1) than other times of the year, according to the U.S. Census Bureau’s Quarterly Workforce Indicators (QWI) (Figure 1).
This pattern is not true for the overall workforce. The increase in employment from the second quarter to the third for all age cohorts is significantly smaller and there is no consistent decrease in employment from the third quarter to the fourth.
Summer employment for young workers also provides a crucial source of labor for employers in need of part-time and seasonal positions.
But that may be changing as young workers’ employment in the summer months has trended downward over the last 20 years, failing to fully recover from the early 2000's recession and Great Recession.
Although summer employment and overall employment levels for young workers have rebounded over the last decade, they are still lower than before the Great Recession.
When looking at the beginning of third-quarter employment of young workers since 1993, none of the top 15 quarters have occurred in the last decade.
Economy and Summer Employment
Summer employment peaks for young workers have changed over time.
Although the 14-18 age cohort consistently exhibits the largest increases between spring and summer employment (third quarter minus second quarter), the magnitude of these increases fluctuates with external economic shocks, such as the Great Recession and the COVID-19 pandemic.
Going into the Great Recession, the percentage increase from the second quarter to the third quarter dropped to its lowest level in the time series (Figure 2).
After the recession, the summer employment boom for those ages 14-18 recovered quickly (after an increase of only 8% in 2009) to 17% in 2010 and a consistent percentage increase in the low 20’s from 2012-2017.
Drop in Young People Working Summer Jobs
Although summer employment and overall employment levels for young workers have rebounded over the last decade, they are still lower than before the Great Recession.
Compare that trend with other age groups over this time period and the divergence of older and younger workers’ employment levels since the third quarter of 2000 is stark.
Older workers, particularly workers ages 55-64 and 65-99, comprise an increasing share of the employed population (Figure 3).
Interestingly, employment levels for workers ages 14-18 dropped the most during the Great Recession. Summer employment for the youngest workers fell substantially in 2008 and 2009 and has not recovered as quickly as for older age groups.
It’s too early to tell how the COVID-19 pandemic has impacted summer employment for young workers, but we can see workers ages 14-18 had the second largest percentage drop in the beginning of third-quarter employment between 2019 and 2020 (Table 1).
Additional quarterly data will allow for a more complete understanding of this dynamic.
Youth Summer Employment by State
How do these trends differ at the state level?
The top 10 states for share of employment for workers ages 14-18 over the last 20 years are South Dakota, Utah, Iowa, Wisconsin, Nebraska, Wyoming, Idaho, North Dakota, Minnesota, and Montana.
These states are diverse in terms of where they rank for population share under the age of 18 as of 2019 — South Dakota, Utah, Nebraska, and Idaho rank in the top 10, while Montana and Wisconsin are in the bottom half of states.
Summer youth employment in North Dakota weathered the Great Recession better than other states, perhaps due to employment opportunities during the Bakken oil boom (Figure 4).
But employment has not kept pace with other states’ growth since 2015. Contrast that with Idaho and Utah, where youth employment was significantly impacted by the Great Recession but has increased dramatically in the last decade.
Youth summer employment in Idaho, Utah, and Montana appear to have been impacted the least by the COVID-19 pandemic, as of the third quarter of 2021.
Youth Summer Earnings by State
What youth earn for working over the summer varies by state.
Average monthly earnings for young workers for the 10 most recent third quarters (2011-2020) show that the District of Columbia, California, Washington, Oregon, and Nevada offer the highest earnings for young workers (Figure 5).
Young workers employed in states in the Midwest and South had the lowest summer earnings over this time period.
These geographic patterns are not unique to young workers — states on the east and west coasts offered the highest earnings for older workers, too. Massachusetts, New York, and Connecticut are in the top five states for third quarter earnings for workers older than 19.
State and regional differences in youth summer employment and earnings can be driven by industry-level trends, as discussed below.
Youth Summer Employment by Industry
Employment as of July 1 in the Retail Trade and Accommodation and Food Services sectors dwarf other industries in its share of young worker employment (Figure 6).
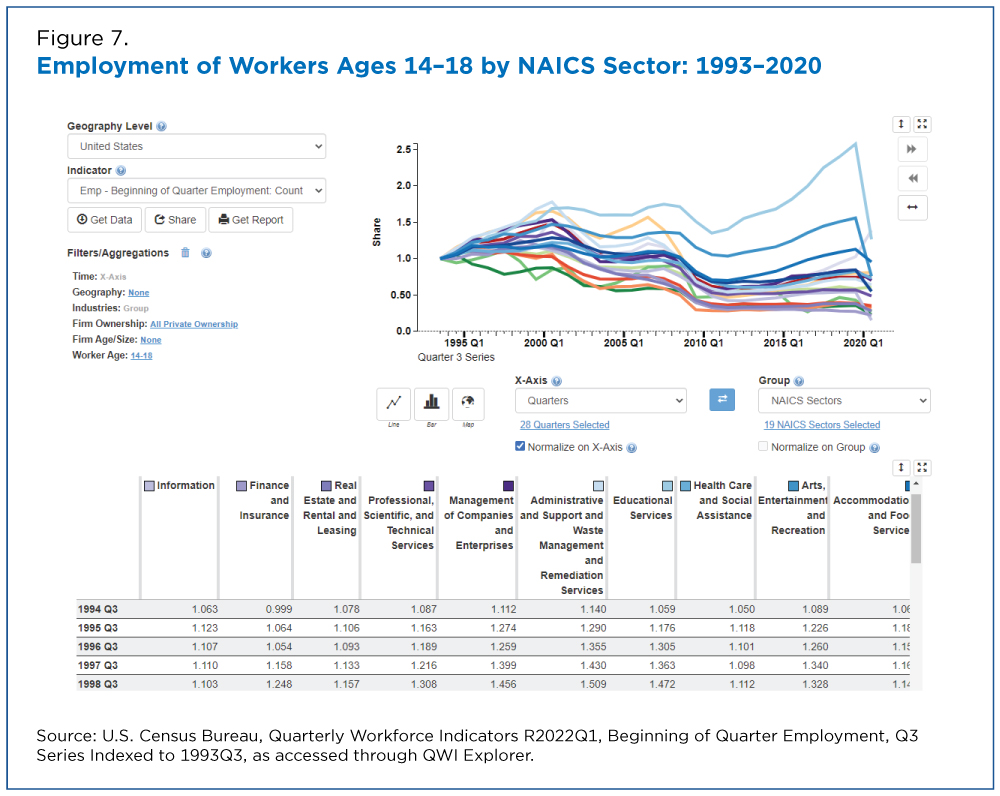
But the story changes when we look at employment changes since the beginning of the time series in 1993 (Figure 7).
Employment in Education Services has grown the most since 1993, followed by Arts, Entertainment, and Recreation. Interestingly, Transportation and Warehousing has also surged in the last 5 years, perhaps due to the increasing demand for delivery drivers and warehouse workers.
Youth Summer Earnings by Industry
How do summer earnings for workers ages 14-18 vary by industry?
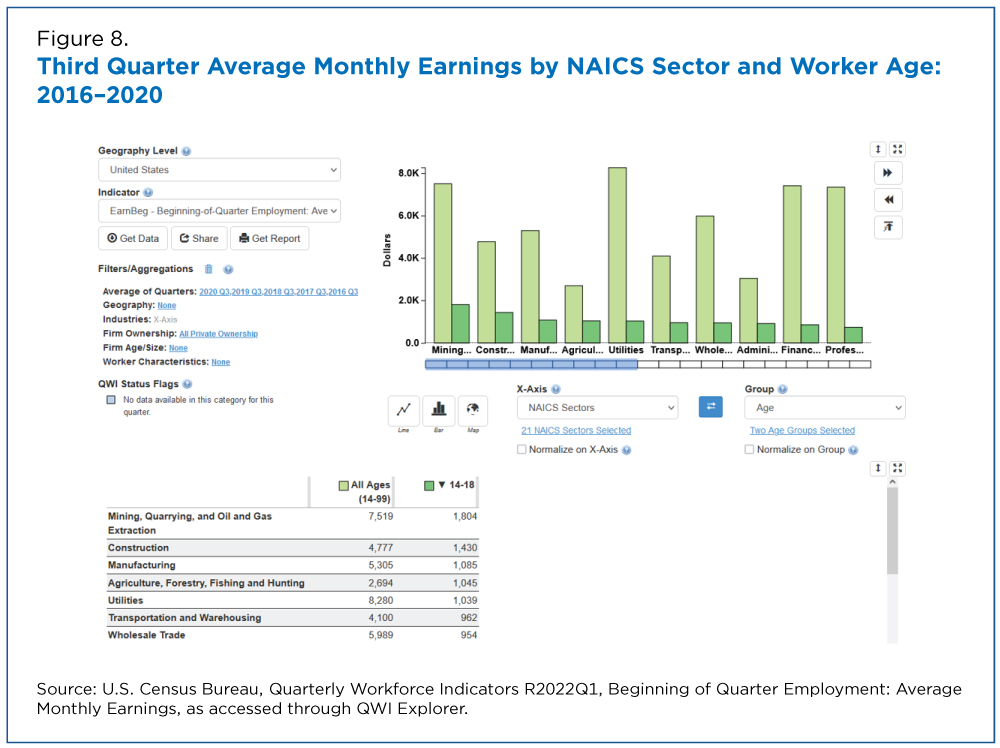
Workers ages 14-18 in Mining, Quarrying and Oil/Gas Extraction earned the most in the third quarter, followed by Construction (Figure 8). Note the Mining industry accounted for less than 0.1% of third quarter youth employment over this period for this age group, while Construction accounted for almost 3%.
While summer earnings have steadily increased for young workers over time, these increases have been relatively evenly distributed between industries.
Additional Workforce Dynamics Resources
The Center for Economic Studies oversees the Local Employment Dynamics (LED) Partnership, a voluntary federal-state partnership that merges worker and employer data to produce enhanced labor market statistics used to research and report workforce dynamics.
Additional LED Partnership data include Job-to-Job Flows (J2J), Post-Secondary Employment Outcomes (PSEO), and LEHD Origin-Destination Employment Statistics (LODES).
All are accessible online for public use. The J2J, PSEO, and LODES data can be analyzed interactively via the J2J Explorer, PSEO Explorer, and OnTheMap applications, respectively.
Related Statistics
-
Stats for StoriesLabor Day: September 4, 2023The 2021 American Community Survey estimated 109.5M full-time, year-round civilian employed population ages 16 and over in the U.S., down from 113.9M in 2019.
-
Stats for StoriesEmployee Appreciation Day: March 1, 2024The American Community Survey estimates that in 2022 there were about 117.0M full-time, year-round civilian workers ages 16 and over in the U.S. and median earn
-
Stats for StoriesEqual Pay Day: March 12, 2024In 1973, full-time working women earned a median of 56.6 cents to every dollar men earned. In 2022 (49 years later), women earned 84.0, a gain of 27.4 cents.
Subscribe
Our email newsletter is sent out on the day we publish a story. Get an alert directly in your inbox to read, share and blog about our newest stories.
Contact our Public Information Office for media inquiries or interviews.
-
America Counts StoryU.S. Startups Create Jobs at Higher Rates, Older Large Firms Employ Most WorkersFebruary 16, 2022The U.S. Census Bureau’s Business Dynamics Statistics show how the age and size of firms contributed to job creation and employment shares from 1976 to 2019.
-
America Counts StoryWhy Did Labor Force Participation Rate Dip When the Economy Was Good?June 21, 2021The U.S. Census Bureau’s 2010-2019 American Community Survey sheds light on the impact of aging baby boomers on the labor force and employment characteristics.
-
America Counts StoryA New Way to Measure How Many Americans Work More Than One JobFebruary 03, 2021The number of workers holding two or more jobs has increased from 1996 to 2018. The Census Bureau’s Longitudinal Employer-Household Dynamics tracks the growth.
-
EmploymentThe Stories Behind Census Numbers in 2025December 22, 2025A year-end review of America Counts stories on everything from families and housing to business and income.
-
Families and Living ArrangementsMore First-Time Moms Live With an Unmarried PartnerDecember 16, 2025About a quarter of all first-time mothers were cohabiting at the time of childbirth in the early 2020s. College-educated moms were more likely to be married.
-
Business and EconomyState Governments Parlay Sports Betting Into Tax WindfallDecember 10, 2025Total state-level sports betting tax revenues has increased 382% since the third quarter of 2021, when data collection began.
-
EmploymentU.S. Workforce is Aging, Especially in Some FirmsDecember 02, 2025Firms in sectors like utilities and manufacturing and states like Maine are more likely to have a high share of workers over age 55.


