
The Chance That Two People Chosen at Random Are of Different Race or Ethnicity Groups Has Increased Since 2010
Background
The 2020 Census used the required two separate questions (one for Hispanic or Latino origin and one for race) to collect the races and ethnicities of the U.S. population — following the standards set by the U.S. Office of Management and Budget (OMB) in 1997.
Building upon our research over the past decade, we improved the design of the two separate questions and updated our data processing and coding procedures for the 2020 Census.
This work began in 2015 with our research and testing centered on findings from our 2015 National Content Test and the designs were implemented in the 2018 Census Test.
In this America Counts story on racial and ethnic diversity, we cross-tabulate the race and Hispanic origin statistics, as data users often do, such as with the 2020 Census redistricting tables.
Here, we see results that are not as impacted by the race reporting patterns of Hispanic or Latino respondents. Thus, we are confident that the changes we are seeing from 2010 to 2020 in the diversity measures, which rely on mutually exclusive Hispanic origin by race groups, likely reflect actual demographic changes in the population over the past 10 years as well as improvements to the question designs, data processing and coding.
We are also confident, as shown in our research over the past decade, that using a single combined question for race and ethnicity in the decennial census would ultimately yield an even more accurate portrait of how the U.S. population self-identifies, especially for people who self-identify as multiracial or multiethnic.
Today’s companion America Counts story on the overview of race and ethnicity explains that differences in overall racial distributions are largely due to design improvements in the two separate questions for race data collection and processing, as well as some demographic changes over the past 10 years.
The improvements and updates enabled a more thorough and accurate depiction of how people self-identify, yielding a more accurate portrait of how people report their Hispanic origin and race within the context of a two-question format. These improvements reveal that the U.S. population is much more multiracial and diverse than what we measured in the past.
The overall racial and ethnic diversity of the country has increased since 2010, according to U.S. Census Bureau analyses released today.
Expectations of what it means for a population to be racially and ethnically diverse may differ.
The concept of “diversity” we use refers to the representation and relative size of different racial and ethnic groups within a population and is maximized when all groups are represented in an area and have equal shares of the population. These measures are used to compare 2010 Census and 2020 Census results.
Measuring Racial and Ethnic Diversity
We present the following measures to describe the racial and ethnic diversity of the U.S. population:
- Diversity Index.
- Prevalence rankings and diffusion score.
- Prevalence maps.
Our recent blog, Measuring Racial and Ethnic Diversity for the 2020 Census, includes detailed information about these specific diversity measures and how to interpret them.
Here we present highlights on racial and ethnic diversity from the 2020 Census and explain what each measure tells us about the nation’s population. More detailed data for the nation, states, counties and Puerto Rico are available in our interactive data visualization.
Categorizing Race and Ethnicity
These diversity calculations require the use of mutually exclusive racial and ethnic (nonoverlapping) categories.
The 1997 OMB standards emphasize that people of Hispanic origin may be of any race. In data tables, such as the 2020 Census redistricting data tables that provide Hispanic origin by race statistics, we often cross-tabulate the race and Hispanic origin categories to display Hispanic as a single category and the non-Hispanic race groups as categories summing up to the total population.
For our analyses, we calculated the Hispanic or Latino population of any race as a category; each of the race alone, non-Hispanic or Latino groups as individual categories (the terms "Hispanic or Latino" and "Hispanic" are used interchangeably in this story); and the Two or More Races non-Hispanic group (referred to throughout this story as the Multiracial non-Hispanic population) as a distinct category.
We know that cross tabulating the race and Hispanic origin categories yields a relatively small Some Other Race alone non-Hispanic population. This is because the vast majority (94%) of responses to the race question that are classified as Some Other Race alone are from people of Hispanic or Latino origin identifying as “Mexican,” “Latino” and other Hispanic origin groups.
Similarly, we do not see the same large increase in the Multiracial non-Hispanic population from 2010 to 2020 using these cross-tabulated categories.
The most prevalent racial or ethnic group for the United States was the White alone non-Hispanic population at 57.8%. This decreased from 63.7% in 2010.
These demographic changes as well as improvements to the ways in which race and ethnicity data are collected and processed reveal the U.S. population is more racially and ethnically diverse than measured in 2010.
The following groups are used in the diversity calculations:
- Hispanic or Latino.
- White alone non-Hispanic.
- Black or African American alone non-Hispanic.
- American Indian and Alaska Native alone non-Hispanic.
- Asian alone non-Hispanic.
- Native Hawaiian and Other Pacific Islander alone non-Hispanic.
- Some Other Race alone non-Hispanic.
- Multiracial non-Hispanic.
We explored using alternative racial and ethnic categories for our analysis but found that they did not have a substantial impact on the overall results.
In addition, we decided to continue using this racial and ethnic cross-tabulation because it is commonly used by the Census Bureau and other data users. We do plan to continue researching how using alternative racial and ethnic categories may inform the diversity measures and share these findings in future publications.
Diversity Index
We use the Diversity Index (DI) to measure the probability that two people chosen at random will be from different racial and ethnic groups.
The DI is bounded between 0 and 1. A value of 0 indicates that everyone in the population has the same racial and ethnic characteristics. A value close to 1 indicates that almost everyone in the population has different racial and ethnic characteristics.
We have converted the probabilities into percentages to make them easier to interpret. In this format, the DI tells us the chance that two people chosen at random will be from different racial and ethnic groups.
Using the same Diversity Index calculation for 2020 and 2010 redistricting data, the chance that two people chosen at random will be from different racial or ethnic groups has increased to 61.1% in 2020 from 54.9% in 2010.
Diversity Index Varies by Geographic Level
During the same period, the largest racial or ethnic group has changed for some states and counties, and local level results illuminate new areas of diversity across the country.
Table 1 shows the 10 states with the highest DI in the 2020 Census and their 2020 and 2010 census values.
In general, the states with the highest DI scores are found in the West (Hawaii, California and Nevada), the South (Maryland and Texas, along with the District of Columbia, a state equivalent) and the Northeast (New York and New Jersey).
Hawaii had the highest DI in 2020 at 76%, which was slightly higher than its 75.1% DI in 2010.
Of the states listed here, Maryland had the largest DI gain, increasing from 60.7% in 2010 to 67.3% in 2020.
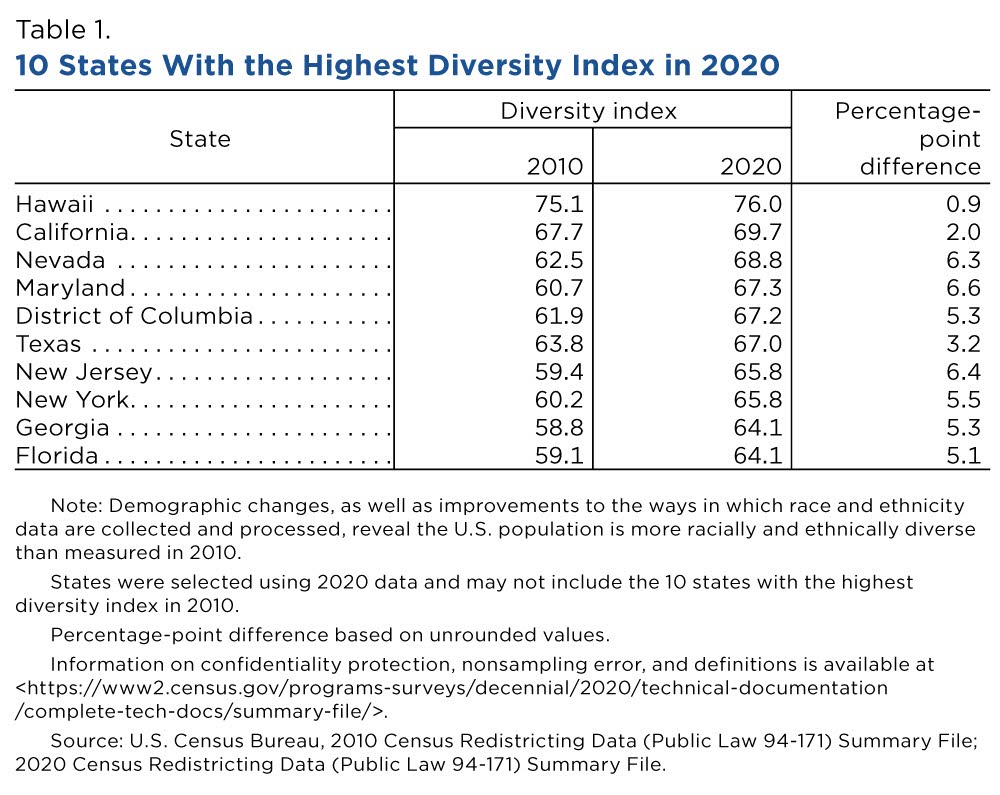
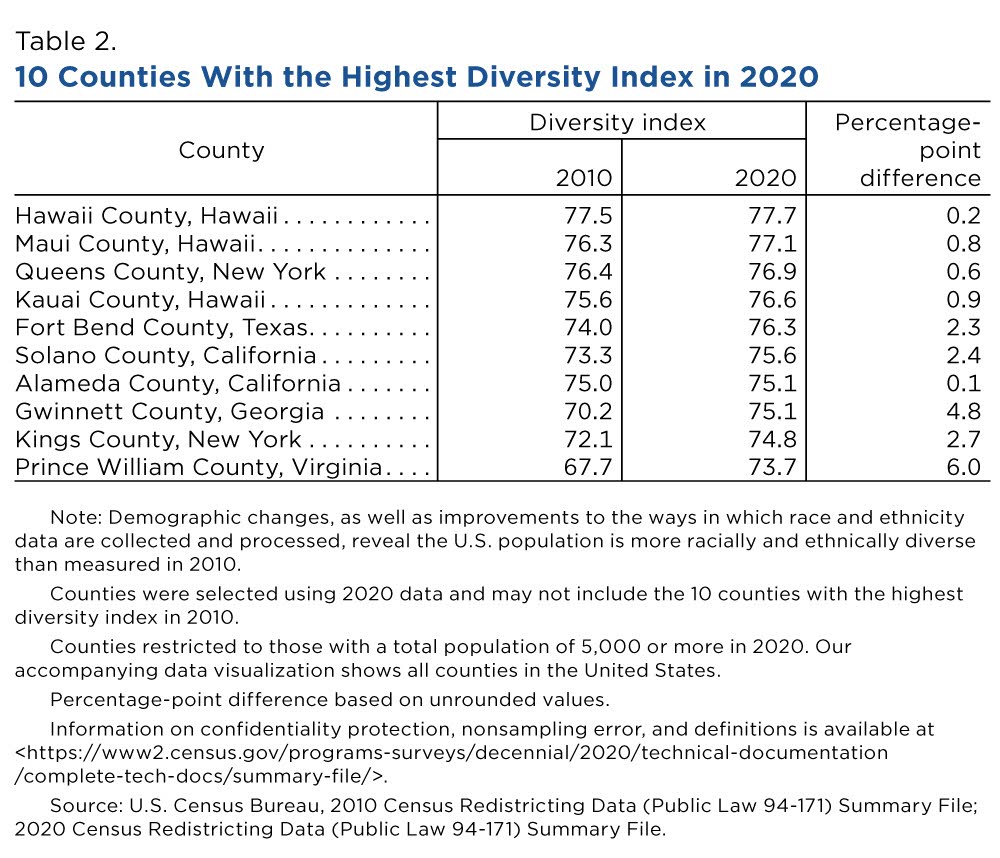
Table 2 shows the 10 counties (with 5,000 or more total population) with the highest DI in 2020 and their scores in 2010.
Again, the way to interpret the DI is that there was a 73.7% chance in Prince William County, Virginia, that two people chosen at random were from different racial or ethnic groups. In Hawaii County, Hawaii, there was a 77.7% chance that two people chosen at random were from different racial or ethnic groups.
You can explore the Diversity Index for all states and counties by interacting with the data visualization.
Prevalence Rankings and Diffusion Score
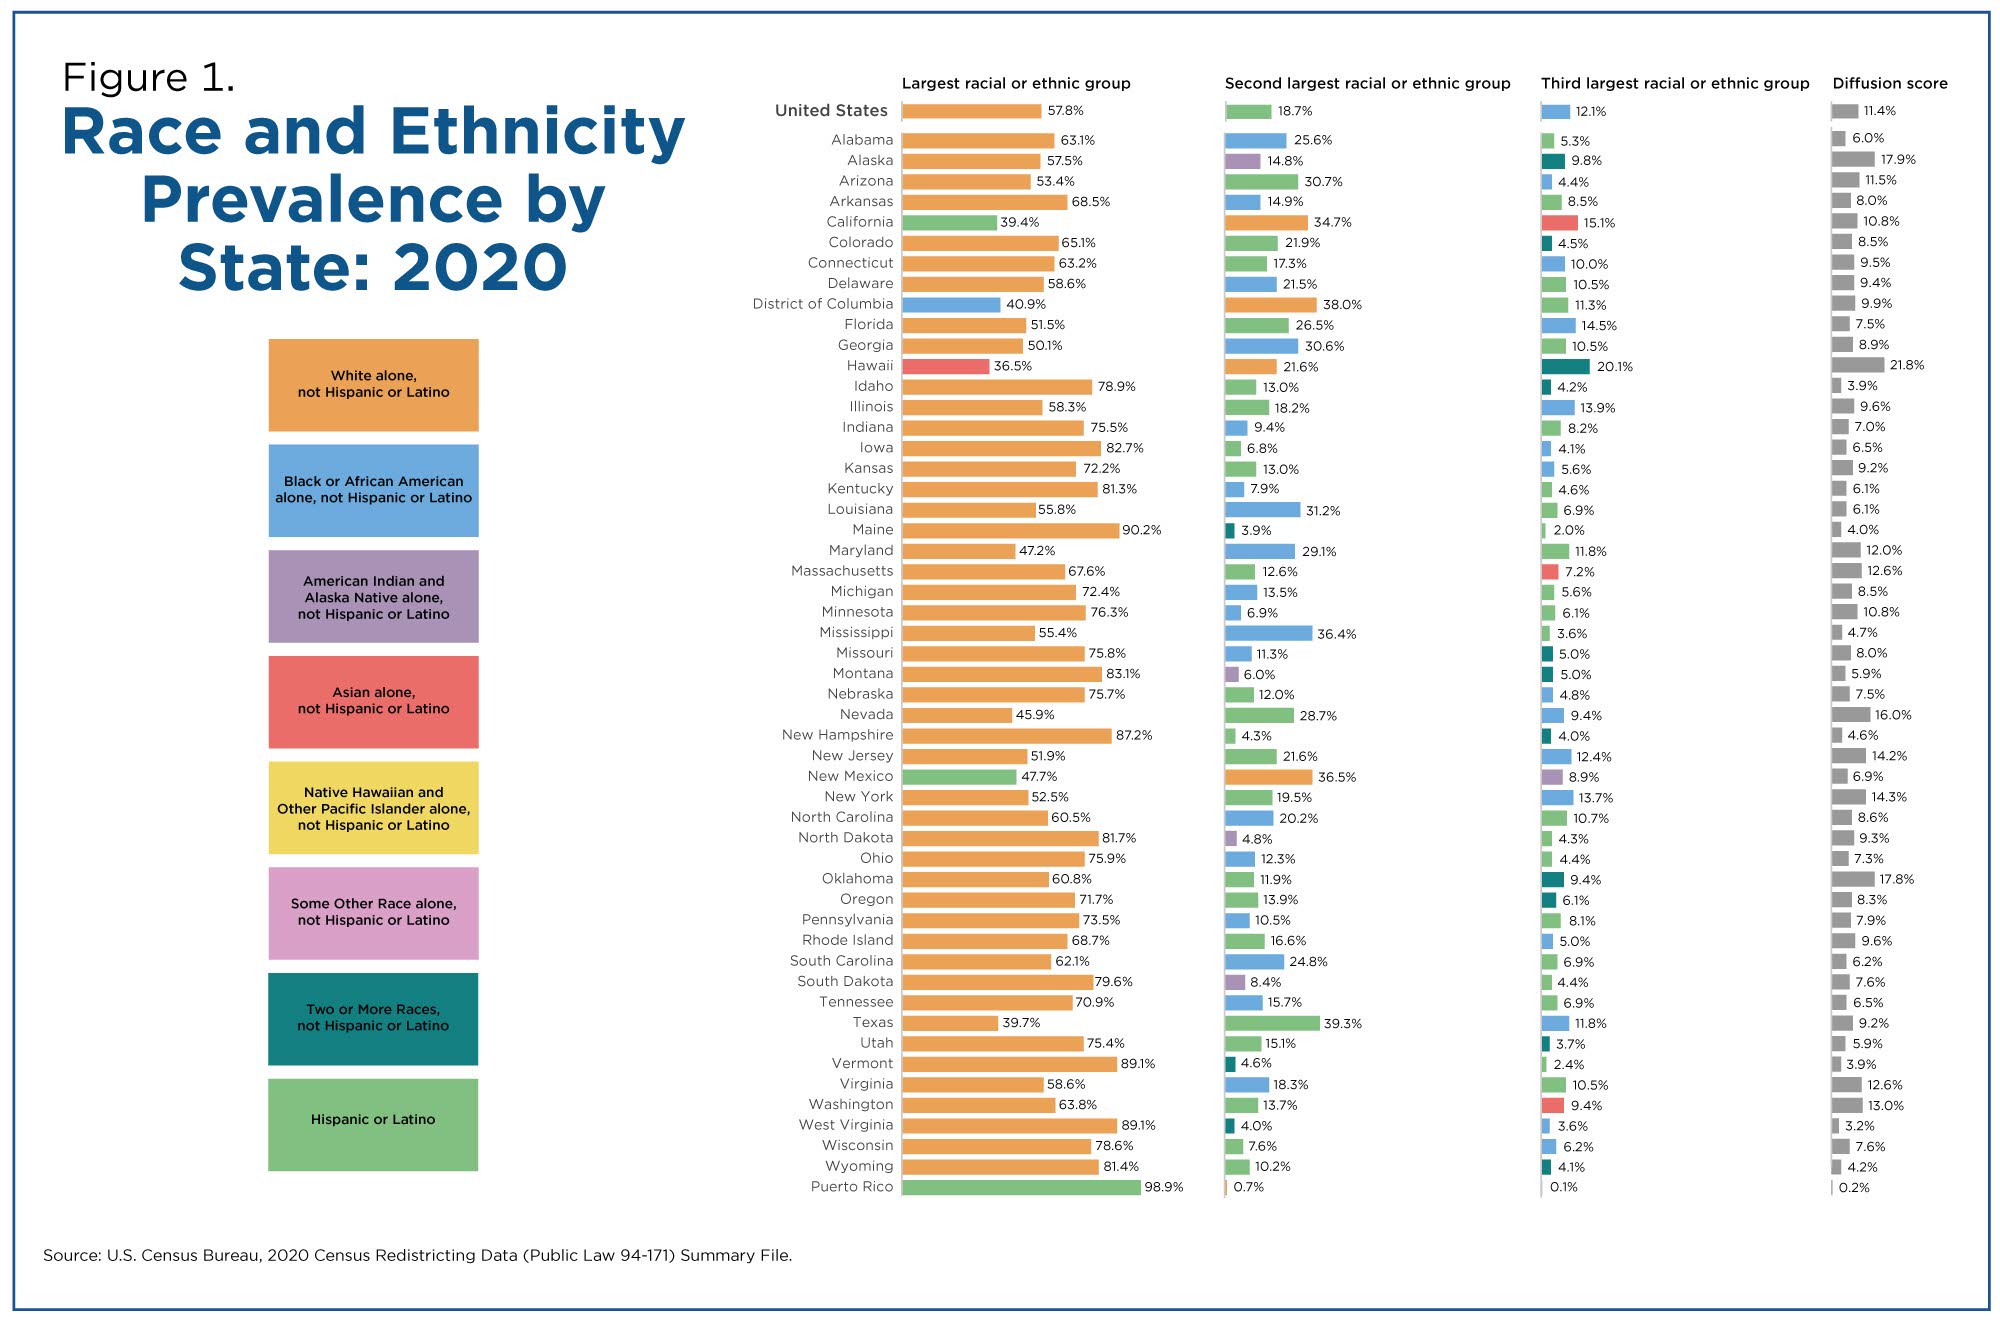
Prevalence rankings illustrate the percent of the population that falls into the first-, second- or third-largest racial or ethnic groups in 2020 (Figure 1):
- The most prevalent racial or ethnic group for the United States was the White alone non-Hispanic population at 57.8%. This decreased from 63.7% in 2010.
- The Hispanic or Latino population was the second-largest racial or ethnic group, comprising 18.7% of the total population.
- The Black or African American alone non-Hispanic population was the third-largest group at 12.1%.
We also calculate the diffusion score, which measures the combined percentage of all racial and ethnic groups that are not in the first-, second- or third-largest racial and ethnic group.
This calculation tells us how diverse and “diffused” the population is relative to the largest groups. The higher the score, the less concentrated the population is in the three largest race and ethnic groups.
The remaining racial and ethnic groups combined to make up 11.4% of the total population, representing the diffusion score.
State Level Changes in Diversity
The White alone non-Hispanic population was the most prevalent racial or ethnic group for all states except California (Hispanic or Latino), Hawaii (Asian alone non-Hispanic), New Mexico (Hispanic or Latino), and the District of Columbia, a state equivalent (Black or African American alone non-Hispanic).
In 2020, the Hispanic or Latino population became the largest racial or ethnic group in California, comprising 39.4% of the total population, up from 37.6% in 2010. This differs from 2010, when the largest racial or ethnic group in California was the White alone non-Hispanic population, whose share declined from 40.1% in 2010 to 34.7% in 2020.
In 2020, we also saw shifts in the second-most prevalent group for some states.
In West Virginia, the Multiracial non-Hispanic population (4.0%) became the second-most prevalent group, surpassing the Black or African American alone non-Hispanic population (3.6%). In Wisconsin, the Hispanic or Latino population (7.6%) became the second-most prevalent group, surpassing the Black or African American alone non-Hispanic population (6.2%).
In Texas, the first- and second-most prevalent group rankings did not change between 2010 and 2020, but the difference in size between the White alone non-Hispanic population (39.7%) and the Hispanic or Latino population (39.3%) shrank to 0.4 percentage points.
For the District of Columbia, the difference in the size of the Black or African American alone non-Hispanic population (40.9%) and the White alone non-Hispanic population (38.0%) narrowed dramatically in 2020 with only a 2.9 percentage point difference.
In contrast, the District of Columbia’s Black or African American alone non-Hispanic population was 50.0% and the White alone non-Hispanic population was 34.8% in 2010, a difference of 15.2 percentage points.
Finally, 2020 Census results showed that Hawaii (21.8%) was the state with the highest diffusion score, followed by Alaska (17.9%), Oklahoma (17.8%) and Nevada (16.0%).
You can explore 2020 Census diversity measures at the state and county level and compare them to 2010 patterns using the “Racial and Ethnic Diversity in the United States: 2010 Census and 2020 Census” data visualization.
How to Access, Download and Visualize Redistricting Data
Get tips and tricks on how to access, visualize and use Census Bureau data. The Census Academy team of data experts these Data Gems.
Prevalence Maps
Figures 2 and 3 show the most and second-most prevalent racial or ethnic groups by county in 2020.
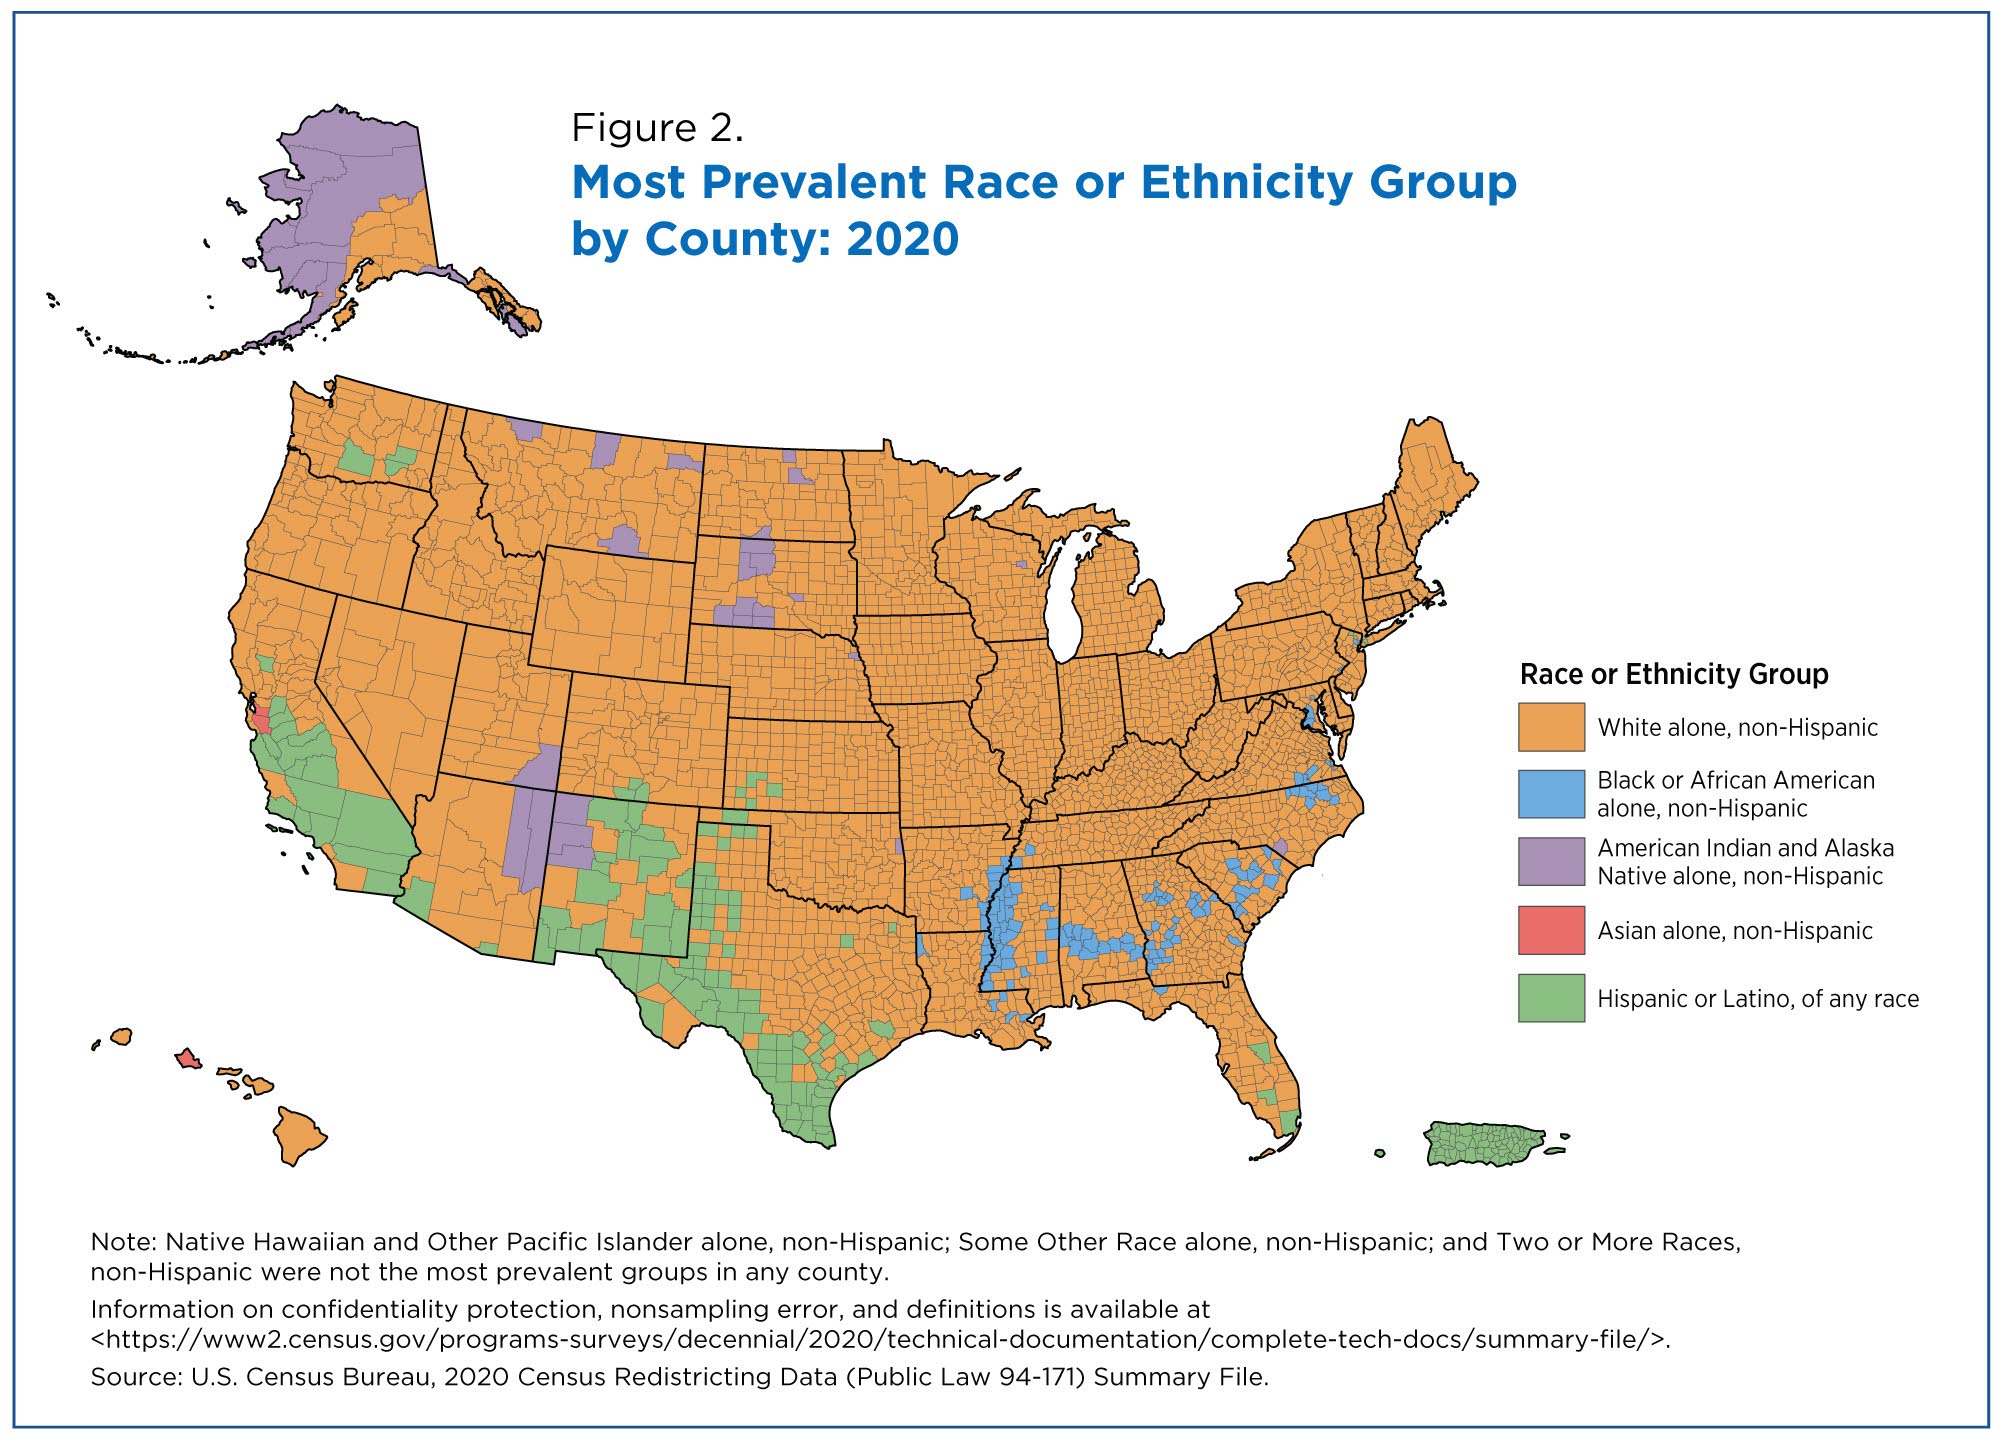
The White alone non-Hispanic population was the largest — or most prevalent — racial or ethnic group for most counties in the United States.
However, other racial or ethnic groups were the most prevalent in certain parts of the country:
- Black or African American alone non-Hispanic population in parts of the South.
- Hispanic or Latino population in the Southwest and West.
- American Indian and Alaska Native alone non-Hispanic population in parts of Alaska and the Southwest and Midwest where there are tribal lands.
There is more variation in the map for the second-most prevalent racial or ethnic group. More racial or ethnic groups are represented and the patterns are not as tightly clustered in specific regions.
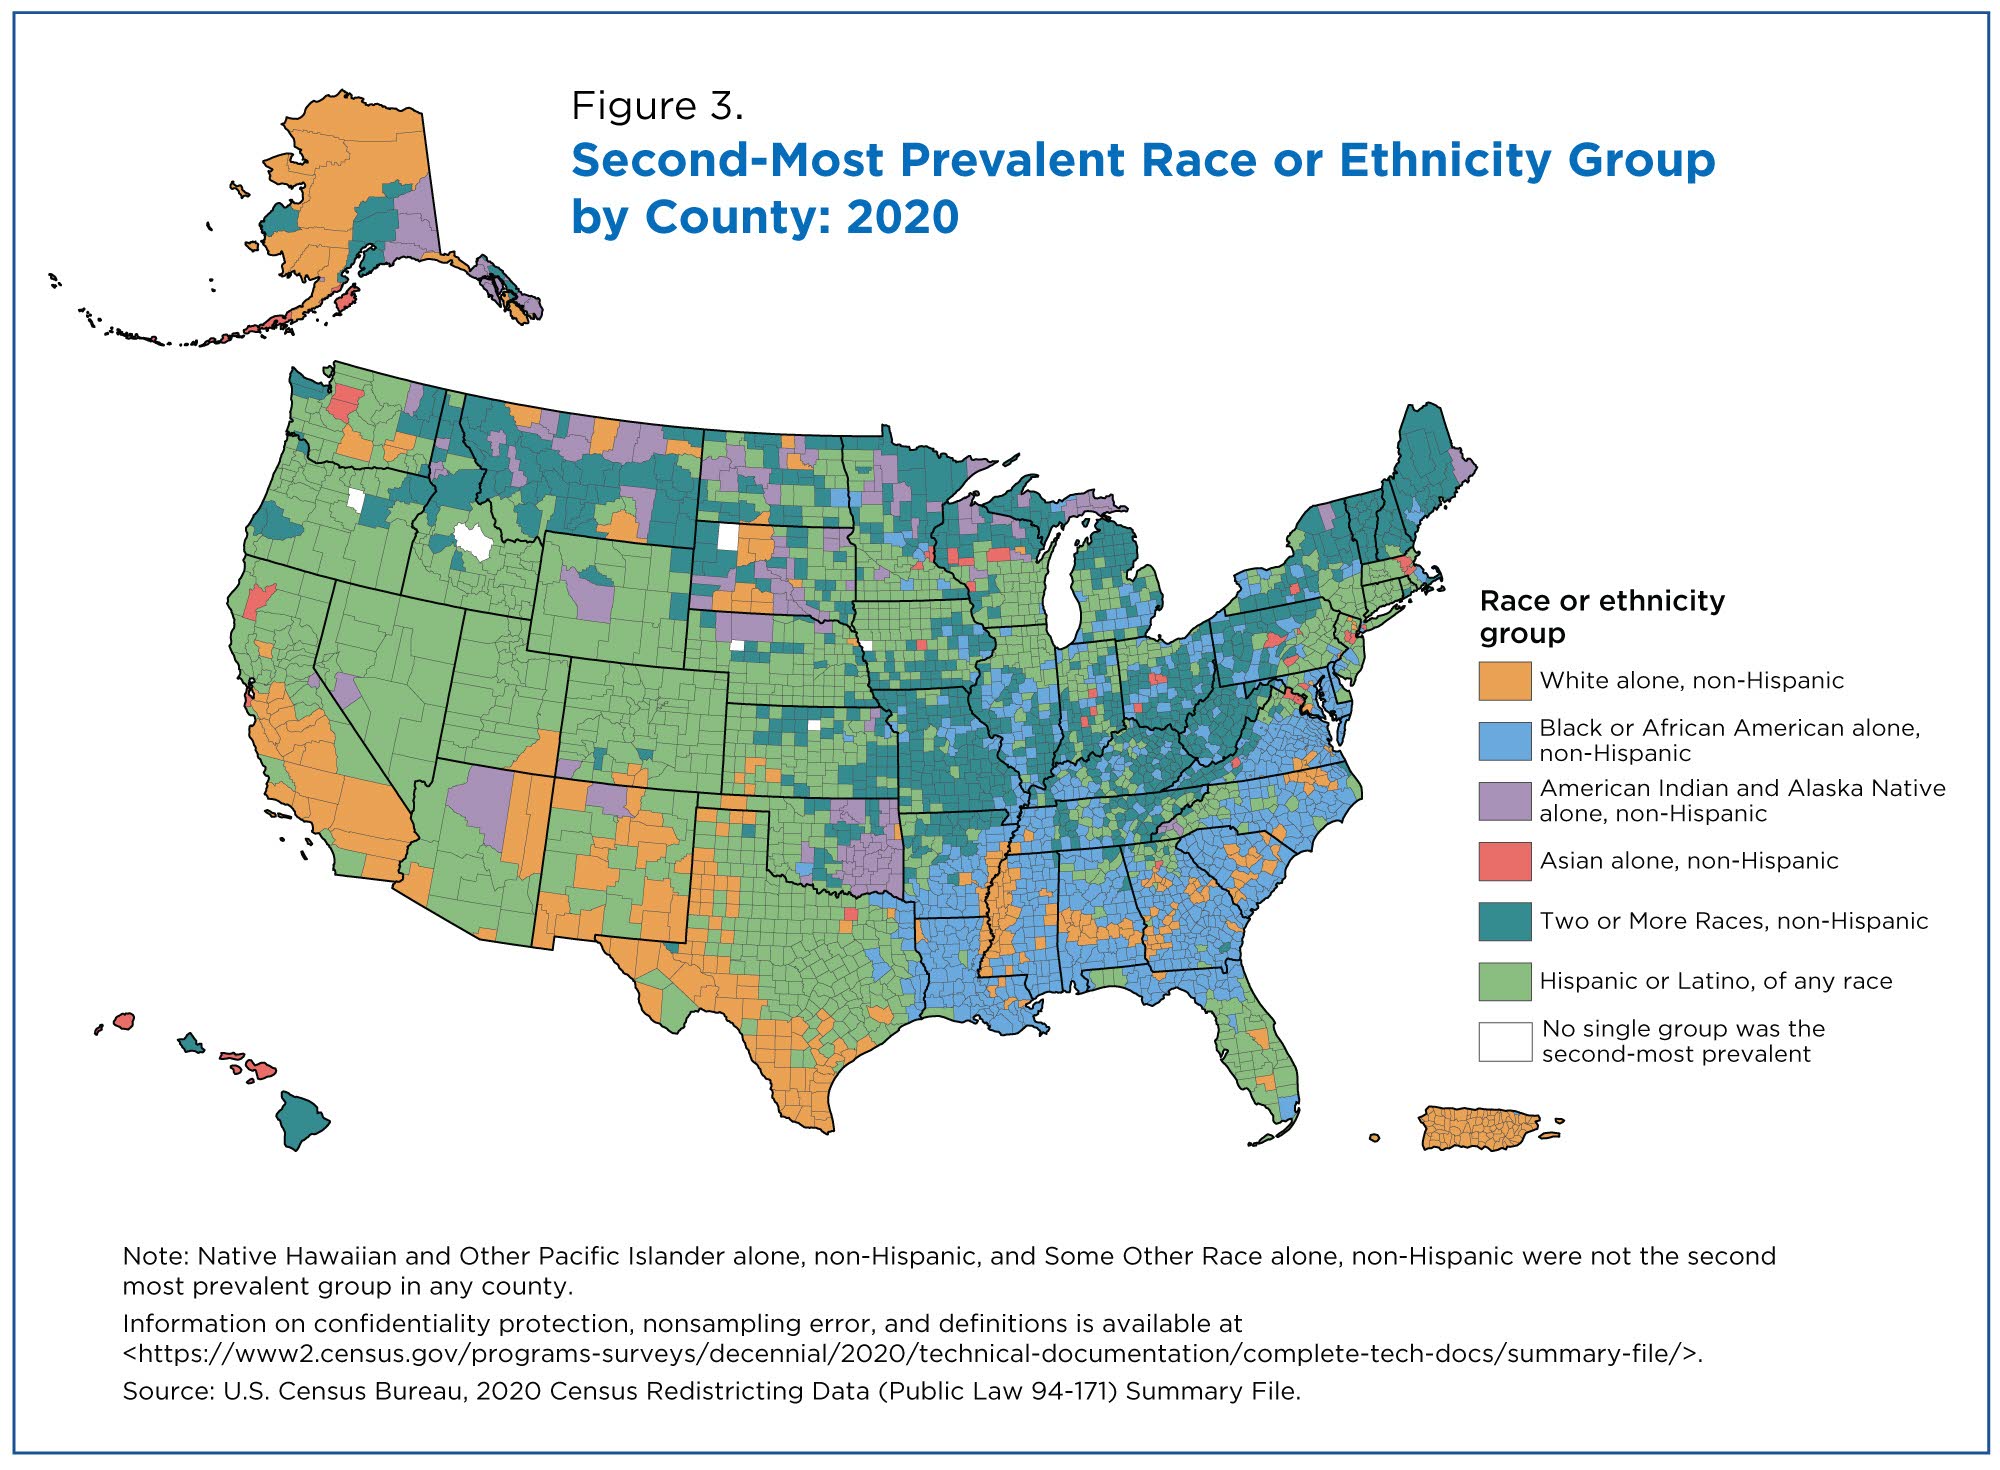
Often, these show an inverse relationship to the most prevalent group map.
- The presence of the Hispanic or Latino population as the second-most prevalent group spanned the entire continental United States, with large numbers of counties in every region.
- The Multiracial non-Hispanic population was the second-most prevalent group in many counties throughout the northern part of the country as well as Alaska and Hawaii.
- Counties where the Black or African American alone non-Hispanic population was the second-most prevalent group are mostly concentrated in the South; it was also the second-most prevalent group in parts of the Northeast and Midwest. This is similar to patterns we observed in the 2010 Census.
- Counties where the American Indian and Alaska Native alone non-Hispanic population was the second-most prevalent are clustered in states that traditionally have large American Indian and Alaska Native populations, such as Oklahoma, Alaska, North Dakota and South Dakota.
- The White alone non-Hispanic population was the second-most prevalent group in parts of the South and the West.
- Following a similar pattern as in 2010, the Asian alone non-Hispanic population was the second-most prevalent group in several counties throughout the Northeast, West, Alaska and Hawaii.
- The Native Hawaiian and Other Pacific Islander alone non-Hispanic population and the Some Other Race alone non-Hispanic population were not the second-most prevalent group in any state, county or region.
You can explore the 2020 Census prevalence maps in detail at the county level and compare them to the patterns in 2010 using the “Racial and Ethnic Diversity in the United States: 2010 Census and 2020 Census” data visualization.
These multiple measures of diversity complement the 2020 Census redistricting data release and enable us to explore the richness and complexity of our nation’s population in a new light.
Related Information
For more information on how the Census Bureau collects, codes and tabulates statistics on Hispanic or Latino origin and race, explore our 2020 Census subject definitions pages and the 2020 Census Redistricting Technical Documentation.
Information on the application of differential privacy and data accuracy for the 2020 Census at various levels of geography are available on 2020 Census Data Products: Disclosure Avoidance Modernization website.
All the authors are in the Census Bureau’s Population Division:
Eric Jensen is the senior technical expert for Demographic Analysis.
Nicholas Jones is the director and senior advisor for Race and Ethnicity Research and Outreach.
Megan Rabe is a demographic statistician for Sex and Age Statistics.
Beverly Pratt is a demographic statistician for Race and Ethnicity Research and Outreach.
Lauren Medina is a demographic statistician for Population Statistics.
Kimberly Orozco is a demographic statistician for Population Statistics.
Lindsay Spell is a geographer in the Population Geography Staff.

Redistricting & Voting Rights Data Office (RDO)
Visualizations

2020 Census Demographic Data Map Viewer is a web map application that includes state-, county-, and census tract-level data from the 2020 Census.
Data
Fact Sheets
Blog Posts
Newsroom
Census Academy
View training resources for 2020 Census data.
Videos
Maps
-
2020 Census Demographic Data Map ViewerThe 2020 Census Demographic Data Map Viewer is web map application that includes state, county, and tract-level data from the 2020 Census.
-
2020 Census P.L. 94-171 Redistricting Data Map SuiteHere you will find the 2020 Census P.L. 94-171 Redistricting Data Map Suite
-
TIGER/Line ShapefilesView all the available mapping files from the Geography program.
How Do I Access Data for My Neighborhood (tracts & blocks) from the 2020 Census Redistricting Files?
Subscribe
Our email newsletter is sent out on the day we publish a story. Get an alert directly in your inbox to read, share and blog about our newest stories.
Contact our Public Information Office for media inquiries or interviews.
-
America Counts StoryImproved Race, Ethnicity Measures Show U.S. is More MultiracialAugust 12, 2021Today’s release of 2020 Census data provides a new snapshot of the racial and ethnic composition of the country.
-
America Counts StoryMore Than Half of U.S. Counties Were Smaller in 2020 Than in 2010August 12, 2021The U.S. Census Bureau today released the first 2020 Census population counts for counties, metropolitan and micropolitan statistical areas, and cities.
-
America Counts StoryWhat Do We Know About the Quality of 2020 Census Redistricting Data?August 12, 2021To assess the quality of the redistricting data released today, we compared 2020 Census to key data benchmarks.
-
America Counts Story8.2 Million People Counted at U.S. Group Quarters in the 2020 CensusAugust 12, 2021The 2020 Census data released today provide counts of the group quarters population down to the block level for the first time in a decade.
-
America Counts StoryAdult Population Grew Faster Than Total Population From 2010 to 2020August 12, 2021The first detailed results of the 2020 Census released today show a nationwide shift in the age makeup of the U.S. population from 2010 to 2020.
-
America Counts StoryGrowth in Housing Units Slowed in the Last DecadeAugust 12, 2021The 2020 Census results released today provide a count of vacant and occupied housing units across the nation.
-
America Counts StoryU.S. Housing Vacancy Rate Declined in Past DecadeAugust 12, 2021The percentage of housing units vacant in 2020 dropped to 9.7% from 11.4% in 2010, according to 2020 Census data released this week.
-
America Counts StorySTATE PROFILES: 2020 CensusWe bring you data visualizations with new 2020 Census data for your state and county on: population, race and ethnicity, diversity, age and housing.
-
Families and Living ArrangementsOver a Third of Partners in Opposite-Sex Couples Were the Same AgeApril 27, 2026A new interactive data visualization explores characteristics of opposite-sex married and unmarried couples who lived together in 2025.
-
PopulationEight of the Nation’s Top 15 Last Names Stayed the Same Since 1790April 14, 2026Newly released names data from the 2020 Census show which first and last names are the most popular across the nation.
-
AgeU.S. Population Aging as Nation Turns 250April 09, 2026New population estimates show women still outnumbered men at older ages, but the gap is narrowing due to lower mortality rates and historical factors.
-
Business and EconomyState Lottery Ticket Sales Soar as Prizes Get LargerApril 08, 2026While sales nearly doubled to $104.7 billion from 2008 to 2024, state lottery prizes more than doubled to $70.2 billion in FY 2024.