Domestic Migration Plays Larger Role in Population Growth of Many Counties in Recent Years
Domestic migration’s role as the main driver of population change intensified between 2016 and 2021, resulting in population gains in some counties and declines in others.
Population estimates for July 1, 2021, released today allow us to look at recent trends in county population change.
During this period (2020-2021), more than half of counties (58%) gained population; domestic migration was the major component of change in 90% of them.
Natural change (the difference between births and deaths), domestic migration and international migration all contribute to how an area’s population changes over time. Some have grown mostly through domestic migration while others have traditionally grown more through natural increase (more births than deaths).
However, in recent years the national pattern has shifted in substantial ways.
As the COVID-19 pandemic continues to amplify existing trends of decreasing births, increasing deaths and slowing international migration, shifts in the remaining component — domestic migration — have become more prominent and are noticeably altering county growth patterns across the nation.
The maps below illustrate how widespread these differences are.
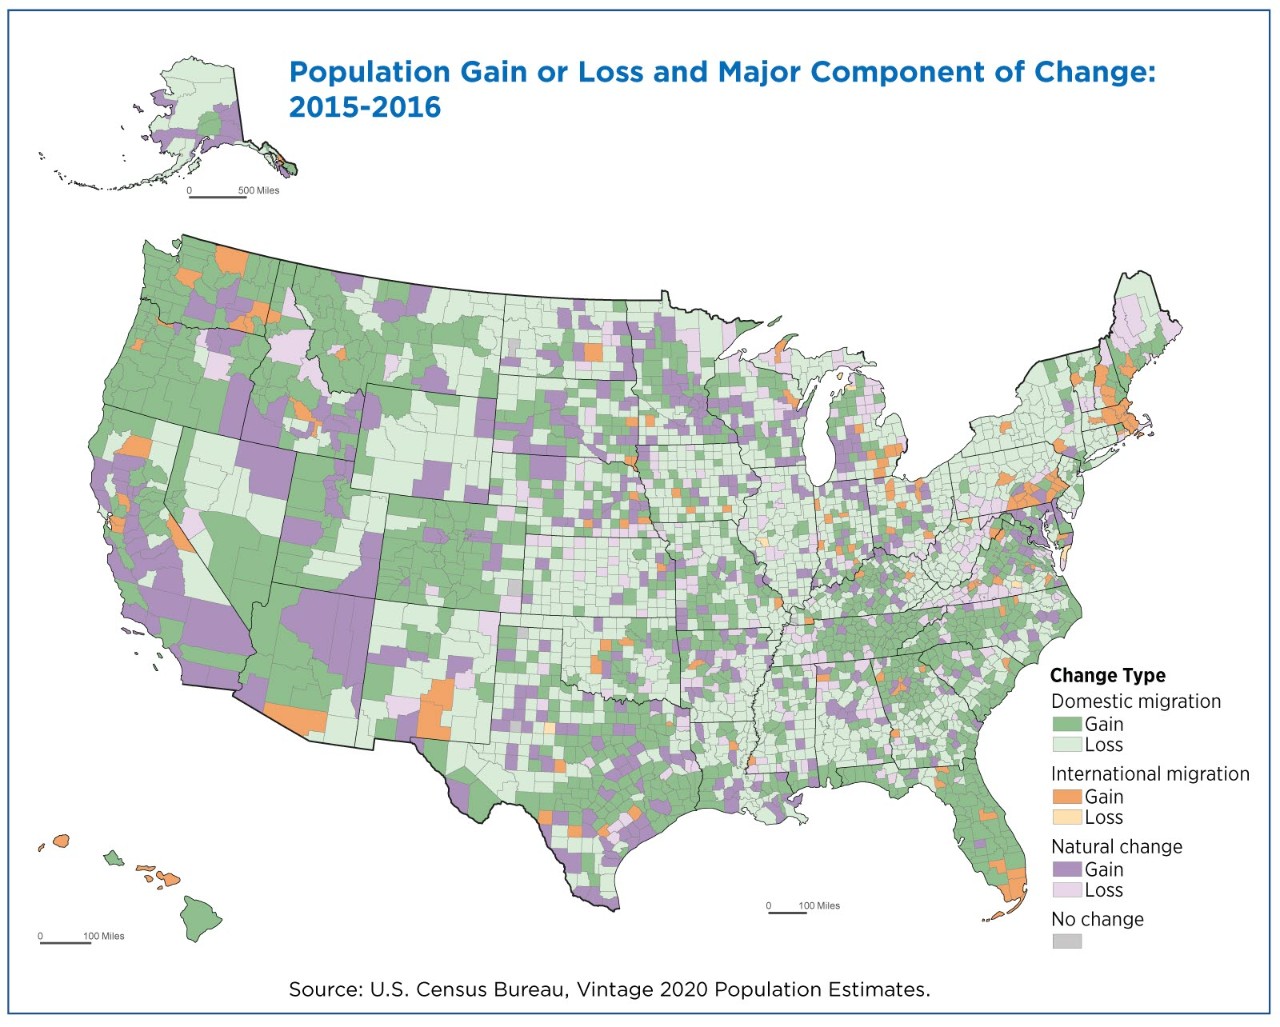
Between 2015 and 2016, counties gaining population (in dark orange, dark green, or dark purple) were located across the country, with concentrations in the West, in Texas metro areas like Dallas and Houston, and in most of Colorado and Florida (Figure 1).
There was also a cluster of gaining counties in Tennessee, Georgia, North Carolina, and South Carolina.
In 65% of gaining counties, net domestic migration was the largest contributing component of change in absolute terms.
Counties shaded light orange, light green or light purple lost population between 2015 and 2016.
As the map shows, many of the areas that lost population (in parts of the Great Plains, the Rust Belt, and the Mississippi Delta), also did so largely because of net domestic migration.
In some parts of the country like Maine, southwest Virginia and West Virginia in Appalachia, the biggest component was natural change.
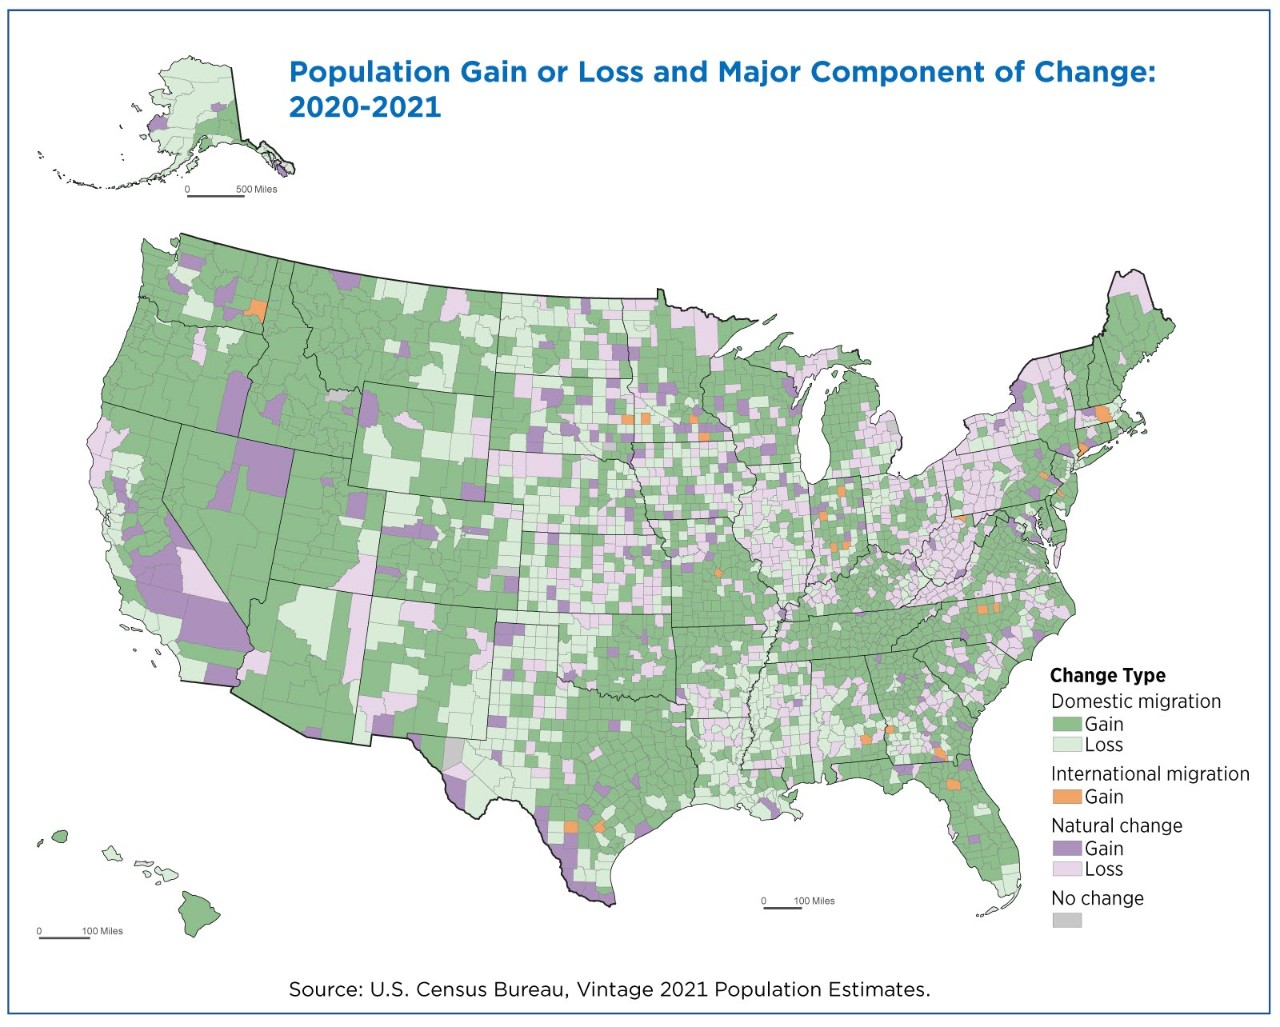
Fast forward to 2020 to 2021, and you can see a widespread change in these patterns.
During this period, more than half of counties (58%) gained population; domestic migration was the major component of change in 90% of them.
The role natural change played in 2020-to-2021 population shifts is also clear: A large swath of counties that lost population mostly because deaths outnumbered births stretched through Appalachia from southwest Virginia all the way to upstate New York.
Although natural decrease (where deaths outnumber births) wasn’t always the largest component, it occurred in 73.1% of counties — a record high.
While this comparison only considers two points in time five years apart, it does show just how unique change was amid the pandemic.
Census demographers provide more information on natural change and domestic migration in other stories.
Subscribe
Our email newsletter is sent out on the day we publish a story. Get an alert directly in your inbox to read, share and blog about our newest stories.
Contact our Public Information Office for media inquiries or interviews.
-
America Counts StoryDeaths Outnumbered Births in Half of All States Between 2020 and 2021March 24, 2022Higher deaths and lower fertility during the COVID-19 pandemic led to natural decrease in nearly three-quarters of the nation’s counties.
-
America Counts StoryNet Domestic Migration Increased in Many U.S. Counties in 2021March 24, 2022Smaller counties were more likely to experience net domestic migration gains and larger counties declines last year, possibly due to the pandemic.
-
America Counts StoryU.S. Deaths Spiked as COVID-19 ContinuedMarch 24, 2022The United States experienced its largest increase in deaths between 2019 and 2020, when the COVID-19 pandemic began.


