New Census Bureau Population Estimates Show COVID-19 Impact on Fertility and Mortality Across the Nation
Half of all states and nearly three quarters of all counties experienced more deaths than births in their populations between July 1, 2020, and June 30, 2021, according to U.S. Census Bureau population estimates released today.
Natural change is a measure of the relationship between births and deaths.
Natural increase happens when there are more births than deaths. Natural decrease means there were more people dying than babies born in a particular population.
Areas with large aging populations often experience natural decrease and shrinking populations in the absence of migration.
Although more states experienced natural decrease in 2021, patterns at the state level may mask trends in lower levels of geography.
While widespread, natural decrease was more common in some regions in 2021:
- Seven out of nine states (78%) in the Northeast had more deaths than births, making this the region with the most widespread natural decrease in 2021.
- The West had the lowest share of states with natural decrease — three out of 13 (23%).
- More states in the South had natural decrease than increase (65%); the reverse was true in the Midwest, where 33% of states had more deaths than births.
Measuring Births and Deaths
The births and deaths included in our annual estimates series are based on final data from the National Center for Health Statistics (NCHS) when possible and supplemental data provided by our state partners through the Federal-State Cooperative for Population Estimates (FSCPE).
For this latest series of estimates, known as Vintage 2021, the last year of final data available from NCHS was 2019. To capture recent trends in births and deaths, including those from the pandemic, we relied on provisional NCHS data for the nation.
We assigned state and county of residence to the vital events using FSCPE distributions and by drawing on patterns observed in the 2019 births and deaths.
The data are not final and are subject to revision. That means the patterns described here may differ from those in our next vintage of estimates (Vintage 2022), which will be updated with final data.
Patterns in Natural Change
The patterns in natural change for 2021 contrast with what was observed in the previous decade and are likely an outcome of the COVID-19 pandemic.
The greatest number of states with natural decrease in a single year from within 2011 to 2020 was eight. That high occurred in the 2019-2020 period, which included four months of COVID-19 exposure.
Aside from 2020, the number of states that experienced more annual deaths than births between 2011 and 2020 ranged from one to four. Only a handful of states — Maine, New Hampshire, Vermont and West Virginia — had recurring natural decrease in the previous decade, and they all had, on average, older populations.
Although more states experienced natural decrease in 2021, patterns at the state level may mask trends in lower levels of geography.
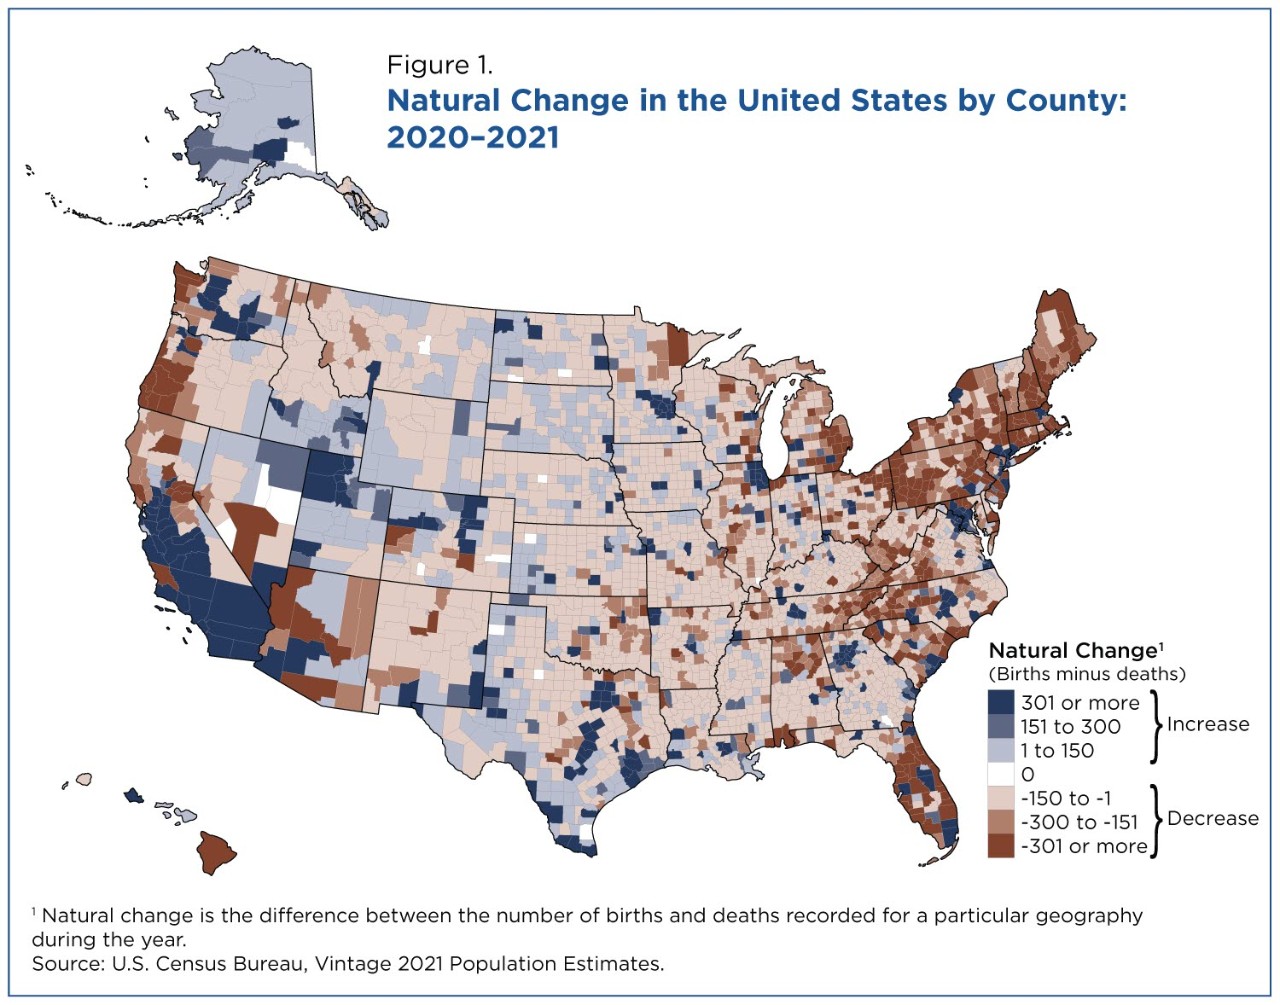
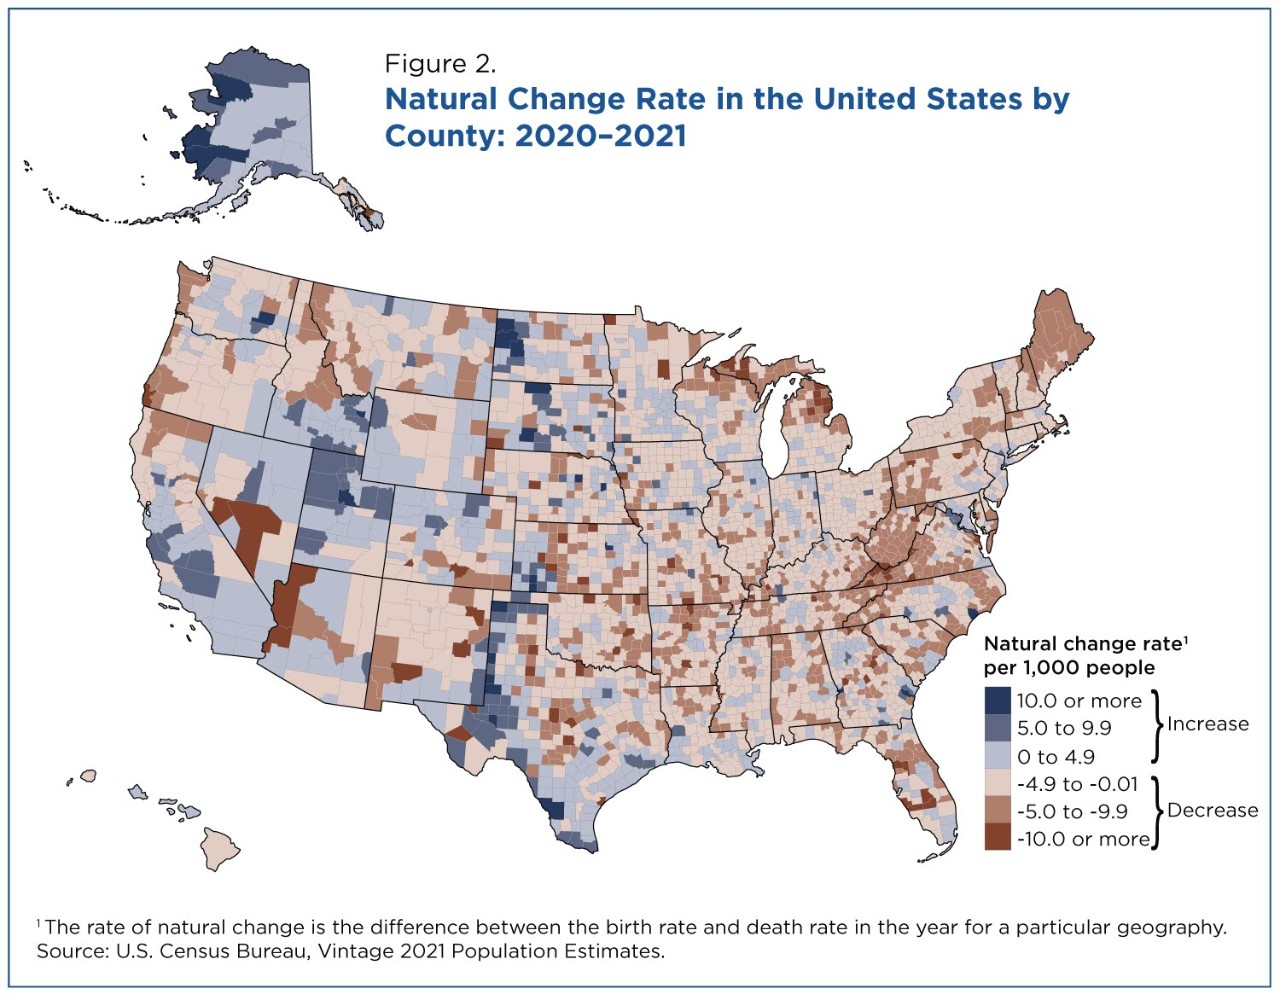
This is true for numeric representations of natural change (Figure 1) and rates of natural change (Figure 2).
For example, Arizona experienced natural increase, which was driven almost exclusively by a single county — Maricopa. Maricopa County had a natural increase of 8,042 people. Yuma County had the state’s next-largest increase (545).
Other big Arizona counties like Yavapai, Pima and Mohave had relatively large natural decreases but not enough to offset the natural increase in Maricopa’s population, resulting in the entire state experiencing natural increase.
There was a similar pattern in New York. Here natural increase in New York City’s five boroughs or counties (along with smaller increases in a handful of other counties) was enough to offset natural decrease in most of the state’s other counties, resulting in natural increase for the state.
Some states experienced the same direction of change as their large counties. In others, natural increase occurred in larger counties but not enough to counteract declines in other counties.
Massachusetts (with increases in Suffolk and Middlesex counties) and Florida (with increases in Miami-Dade, Broward, Hillsborough and Orange counties) experienced natural decrease at the state level despite growth from natural change in larger areas.
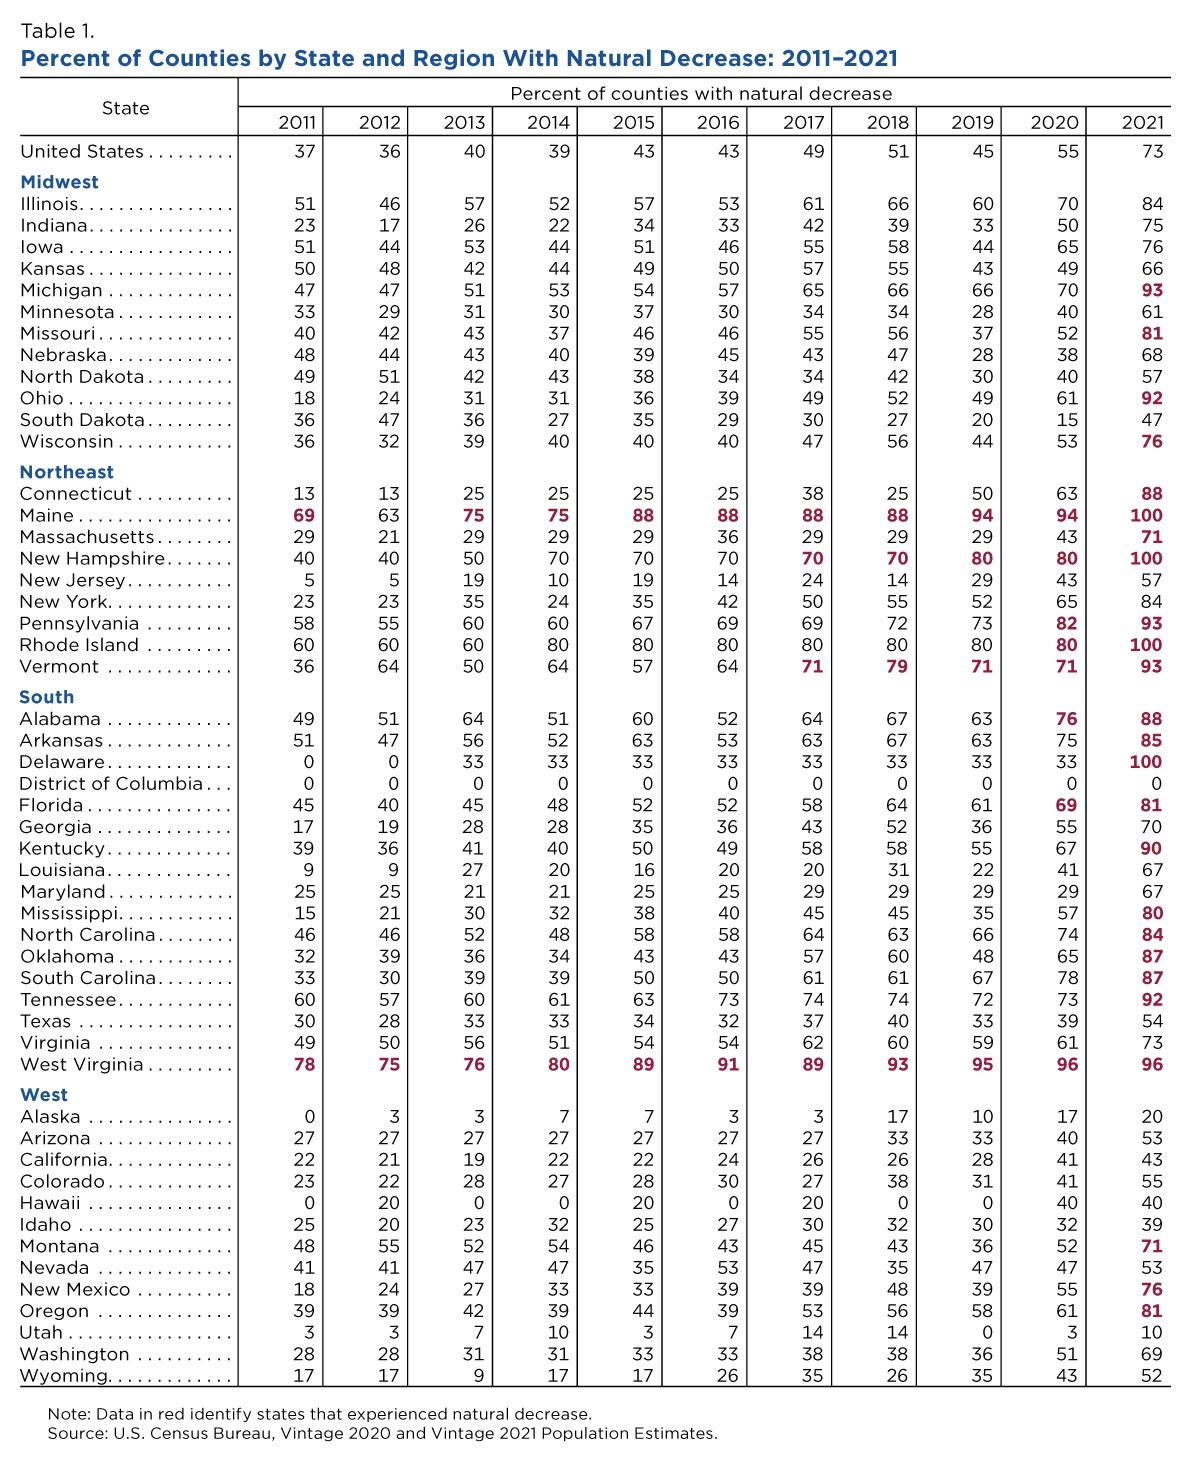
As was the case with states, there were far more counties with natural decrease at the start of this decade than in any year the previous decade (Table 1).
Thirty-seven percent or 1,149 of the nation’s counties had more deaths than births between 2010 and 2011. This increased slightly over the decade, reaching 1,743 (55%) from 2019 to 2020.
The 2020-2021 period was unique because it was the first time the COVID-19 pandemic affected both births and deaths.
In 2021, the number of counties with more deaths than births increased substantially due to the COVID-19 pandemic — 2,297 counties (73%) experienced natural decrease.
All states other than Hawaii and West Virginia had more counties with natural decrease in 2021 than in 2020, and a handful of states in the South and Northeast regions (Delaware, Maine, New Hampshire, and Rhode Island) had natural decrease in all counties.
COVID: Longer-Term Trends and Shifts
The 2020-2021 period was unique because it was the first time the COVID-19 pandemic affected both births and deaths.
The pandemic was declared in March 2020. The first births conceived and carried to full-term during the pandemic were born in December 2020. This means that just over half of the July 1, 2020, to June 30, 2021, estimates period includes births conceived during the pandemic.
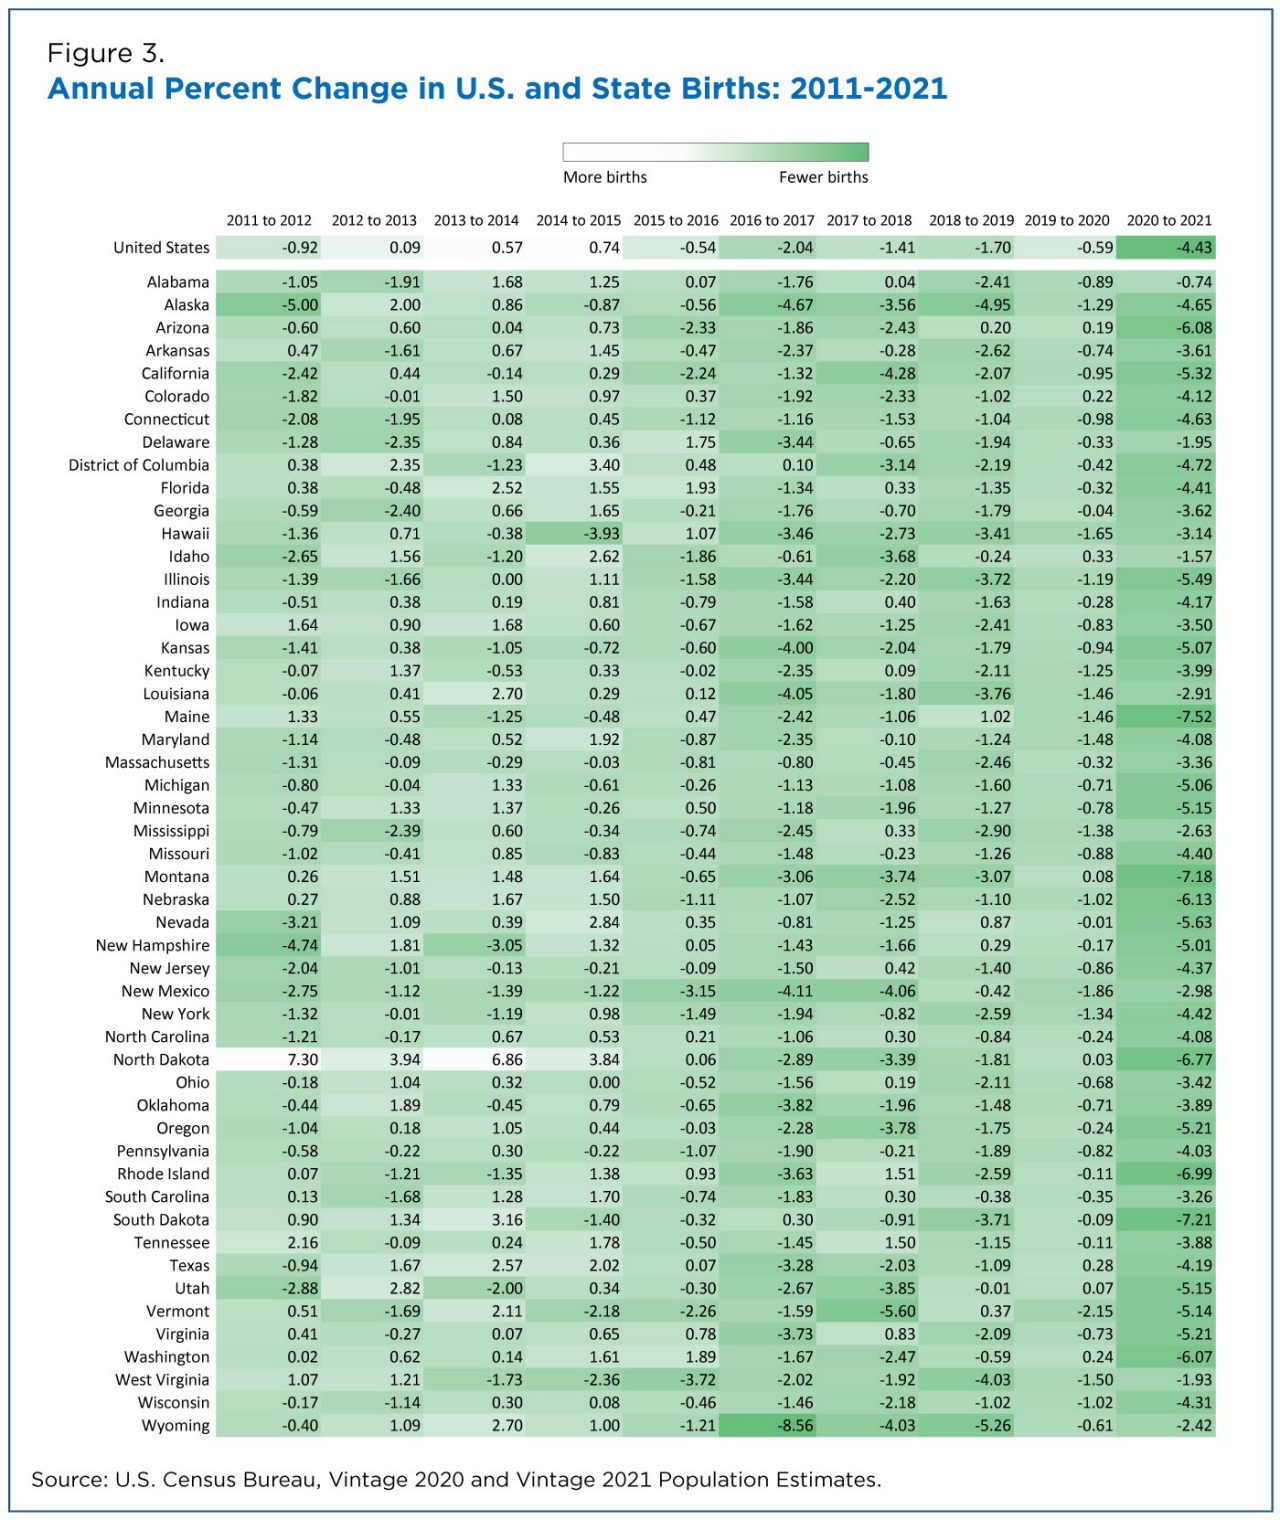
There was much speculation about how the pandemic would influence fertility. Final birth data for the 2021 estimates year are not yet available; however, provisional data suggest that births declined between 2020 and 2021 in all states (Figure 3).
With some exceptions, births in most states had been declining since 2016. Between 2020 and 2021, all states experienced a drop in births. For most states, that one-year slide was larger than any that occurred in the previous decade.
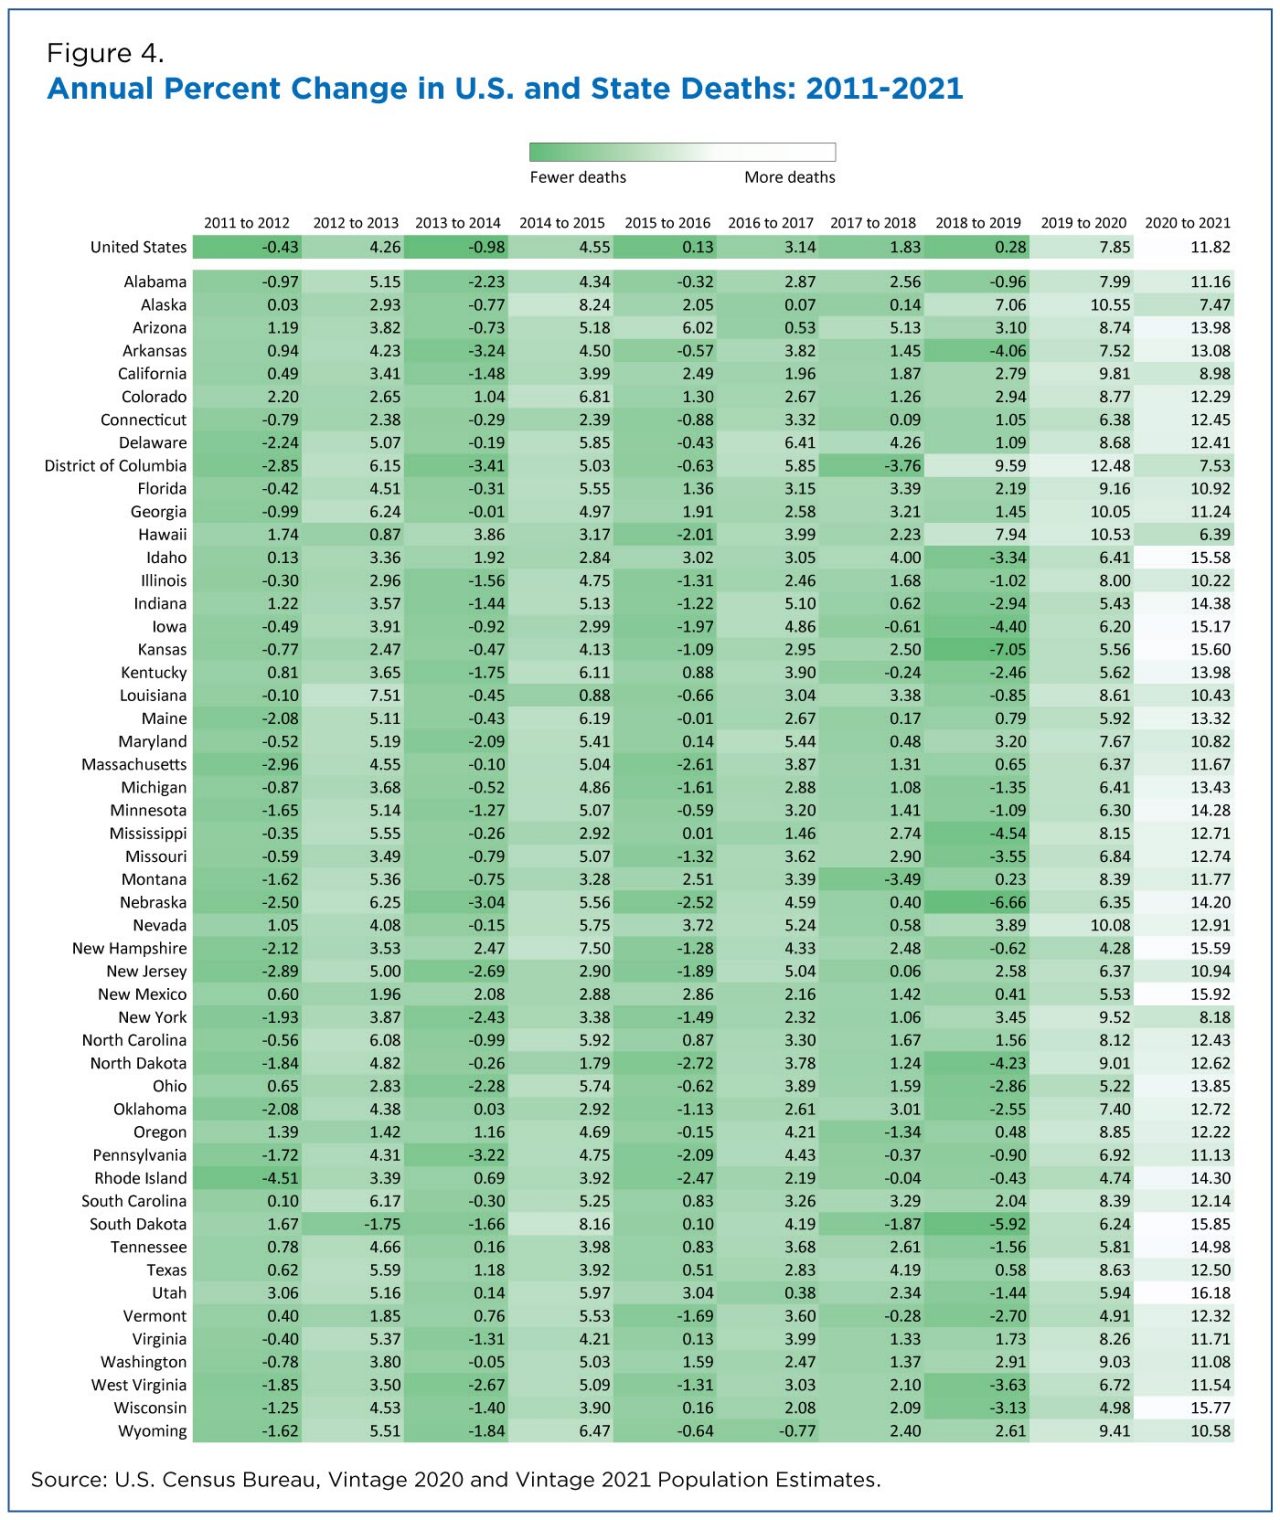
For deaths, the pattern of annual change was less consistent across states in the years prior to the pandemic; states fluctuated between increasing and decreasing with no obvious trend (Figure 4).
But that changed during the 2019-2020 and 2020-2021 periods, when deaths increased in all states. The biggest numeric increases occurred in 2021, which included an entire year of mortality from the pandemic.
Though all states in the estimates experienced declines in births and increases in deaths in 2021, this did not result in natural decrease across the board.
Twenty-five states and the District of Columbia maintained higher levels of births than deaths, leading to population increase through natural change. Among the states with the largest increases were: Texas, California, Utah, New York and Georgia.
Population Change
Births and deaths are only two of the components of population change. Populations also grow or decline because of migration. More information on the 2021 population estimates for states and counties can be found in the news release.
Subscribe
Our email newsletter is sent out on the day we publish a story. Get an alert directly in your inbox to read, share and blog about our newest stories.
Contact our Public Information Office for media inquiries or interviews.
-
America Counts StoryU.S. Deaths Spiked as COVID-19 ContinuedMarch 24, 2022The United States experienced its largest increase in deaths between 2019 and 2020, when the COVID-19 pandemic began.
-
America Counts StoryNet Domestic Migration Increased in Many U.S. Counties in 2021March 24, 2022Smaller counties were more likely to experience net domestic migration gains and larger counties declines last year, possibly due to the pandemic.
-
America Counts StoryWhat Has Driven Population Change in U.S. Counties?March 24, 2022In most counties, domestic migration played a larger role in population growth than births, deaths and international migration, possibly due to the pandemic.


