Two Ways the U.S. Census Bureau Measures Poverty to Capture Clearer Picture of Poverty in America
There were 37.3 million people in poverty in 2020, according to the official poverty measure. In contrast, there were 29.8 million people in poverty that same year, according to the Supplemental Poverty Measure.
While these measures may seem at odds with each other, they each present a different angle of poverty in the United States.
In recognition of National Poverty in America Awareness Month this month, the U.S. Census Bureau is highlighting two poverty measures it uses to capture a clearer picture of poverty and equity in the United States.
The official poverty measure has remained mostly unchanged since the mid-1960s, but the SPM was designed to keep pace with changes in data, methods, and new research.
The first — the official poverty measure first published in the mid-1960s — is based on cash resources.
The second — the Supplemental Poverty Measure (SPM) — includes both cash and noncash benefits and subtracts necessary expenses (such as taxes and medical expenses).
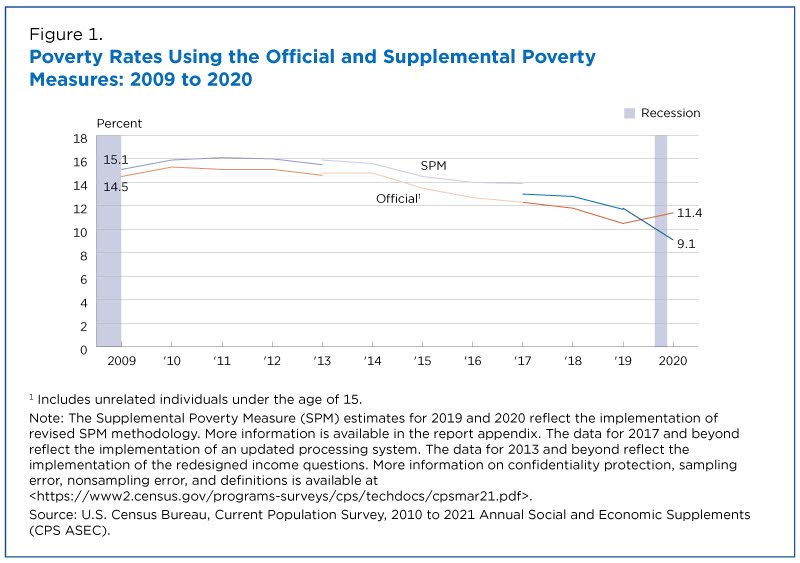
The 2020 SPM rate of 9.1%, the most recent available, was the lowest since the measure was first published in 2009, and the first time the SPM rate was lower than the official poverty rate.
Differences between Poverty Measures
The official poverty measure has remained mostly unchanged since the mid-1960s, but the SPM was designed to keep pace with changes in data, methods, and new research.
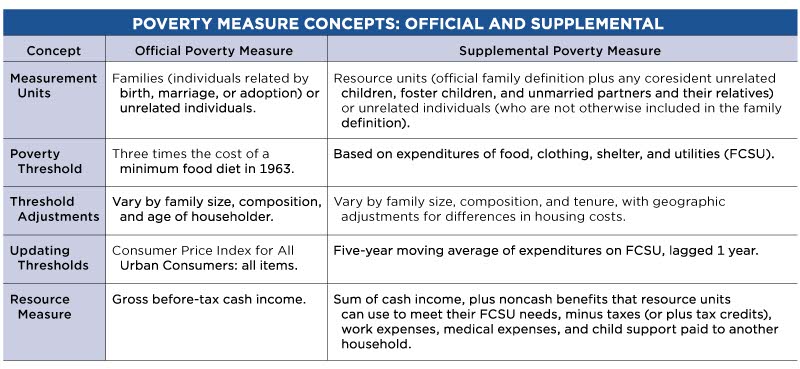
The table below shows a detailed comparison of major concepts between the two measures. (The history of poverty measures in the United States infographic, “How the U.S. Census Bureau Measures Poverty,” and this blog on the difference between SPM and official poverty measures provide more details.)
Official Poverty Measure
The official poverty measure compares an individual’s or family’s pretax cash income to a set of thresholds that vary by family size and the ages of family members.
These official poverty calculations do not account for the value of in-kind benefits such as nutritional assistance, housing and energy programs, or tax credits like the earned income tax credit or stimulus payments.
They also do not consider regional differences in living costs or expenses such as housing.
Supplemental Poverty Measure
On the other hand, the SPM does consider family resources and expenses not included in the official measure as well as geographic variation.
First, it adds the value of refundable tax credits and in-kind benefits available to buy basic goods to cash income. In-kind benefits include nutritional assistance, subsidized housing, and home energy assistance.
Then, it subtracts necessary expenses for critical goods and services not included in the thresholds from resources.
Necessary expenses subtracted include income taxes, Social Security payroll taxes, child care and other work-related expenses, child support payments to another household and medical care and health insurance premium contributions.
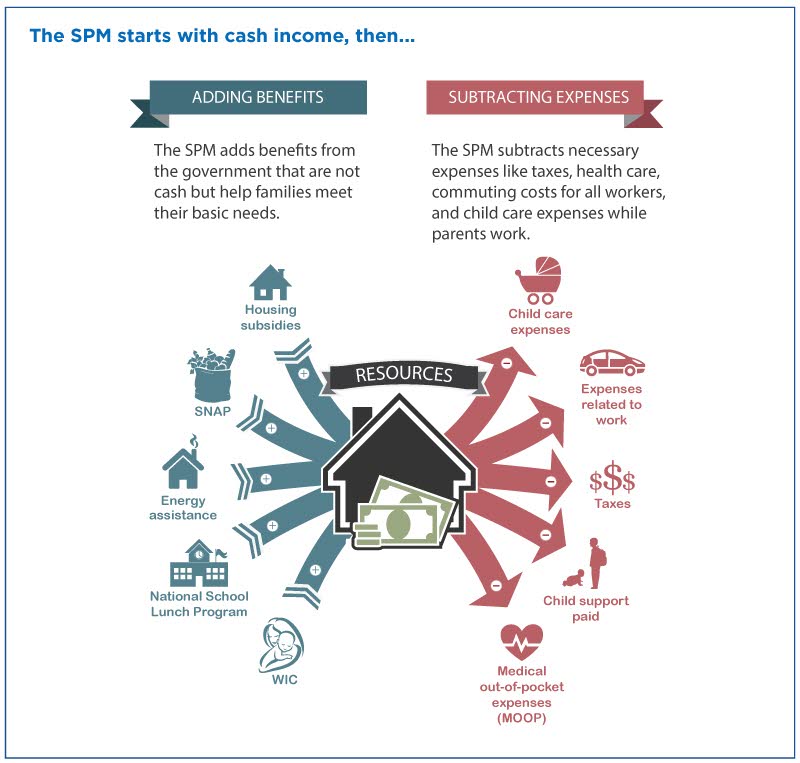
The Bureau of Labor Statistics’ Division of Price and Index Number Research produces the SPM income thresholds based on Consumer Expenditure Survey data that show how much people spend on basic necessities (food, clothing, shelter and utilities) and are adjusted for geographic differences in housing costs.
The SPM thresholds are not intended to assess eligibility for government assistance.
Official vs. Supplemental Poverty Rates
In September 2021, the Census Bureau released the 11th SPM report for 2020. The report presented estimates of both the official and Supplemental Poverty measures and outlined differences between the two.
From 2009 through 2019, the SPM ranged from 0.6 to 1.6 percentage points higher than the official measure (Figure 1).
In contrast, the 2020 SPM was 2.3 percentage points lower than the official measure. This was the first time in the history of the SPM that its poverty rate was lower than the official poverty rate. SPM rates in 2020, which included stimulus payments, were at their lowest level since the first-published SPM estimates.
A recent America Counts story, “Who Was Lifted Out of Poverty by Stimulus Payments?”, showed that without stimulus payments, the supplemental poverty rate would have increased by approximately 3.6 percentage points.
Geographic Variations
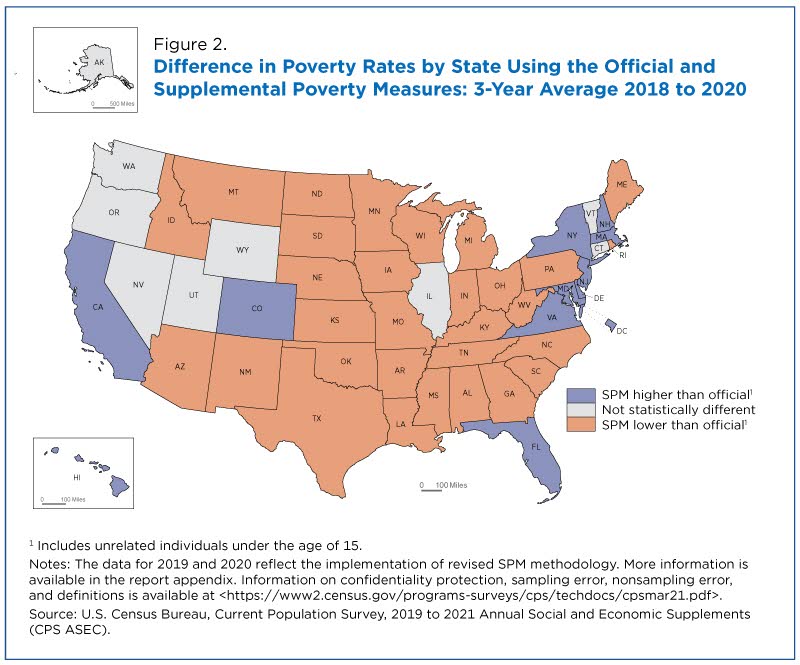
Figure 2 provides state-level supplemental poverty statistics using three years of Current Population Survey Annual Social and Economic Supplement data and compares official poverty and SPM estimates.
In 2020, SPM rates were:
- Higher than official poverty rates in 11 states plus the District of Columbia.
- Lower than official poverty rates in 30 states.
- Not statistically different in nine states.
Poverty Across Age Groups
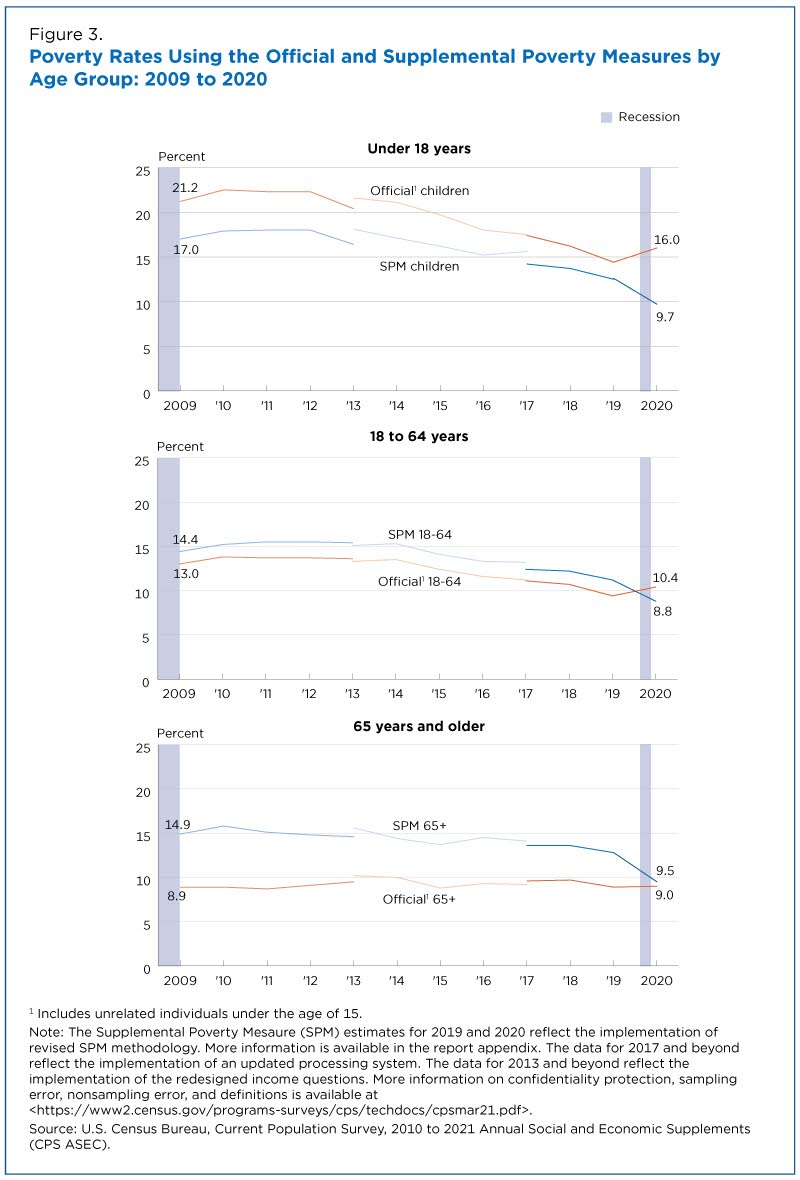
While the SPM rate for children declined between 2019 and 2020, the official poverty rate increased over the same period, widening the gap between the two measures from 1.8 percentage points in 2019 to 6.3 percentage points in 2020 (Figure 3).
SPM rates for individuals ages 18 to 64 were also lower than official poverty rates in 2020, for the first time in the history of the SPM.
The gap between the official and SPM rates for individuals 65 and older declined from 3.9 percentage points in 2019 to 0.5 percentage points in 2020. SPM rates for each major age group in 2020 were at their lowest level since 2009.
Estimates in this story were calculated using the SPM universe, which includes unrelated individuals under age 15.
More details on the impact of policies and programs on the SPM rate are available in the 2020 SPM Report. Additionally, more information on confidentiality protection, methodology, sampling and nonsampling error and definitions is available.
Subscribe
Our email newsletter is sent out on the day we publish a story. Get an alert directly in your inbox to read, share and blog about our newest stories.
Contact our Public Information Office for media inquiries or interviews.
-
America Counts StoryPoverty Rates for Blacks and Hispanics Reached Historic Lows in 2019September 15, 2020Black and Hispanic poverty rates reached historic lows of 18.8% and 15.7% respectively in 2019 but inequalities persist.
-
America Counts StoryNew Census Tool Provides Child Poverty Rates in All School DistrictsOctober 19, 2021The 2019 SAIPE School District Profiles data visualization provides demographic and economic information on more than 13,000 U.S. school districts.
-
America Counts StoryChildren Experienced Episodic Poverty at Higher Rate Than AdultsAugust 30, 2021A recent U.S. Census Bureau report explores episodic and chronic poverty rates among children, working-age adults and seniors from 2013-2016.
-
America Counts StoryFewer People Living in Poverty Areas in 2015-2019February 08, 2021The percentage of people living in poverty areas fell 6.6 percentage points since 2010-2014.
-
IncomeHow Income Varies by Race and GeographyJanuary 29, 2026Median income of non-Hispanic White households declined in five states over the past 15 years: Alaska, Connecticut, Louisiana, Nevada, and New Mexico.
-
HousingRental Costs Up, Mortgages Stayed FlatJanuary 29, 2026Newly Released American Community Survey compares 2020-2024 and 2015-2019 housing costs by county.
-
HousingShare of Owner-Occupied, Mortgage-Free Homes Up in 2024January 29, 2026The share of U.S. homeowners without a mortgage was higher in 2024 than a decade earlier nationwide and in every state, though not all counties saw increases.
-
PopulationU.S. Population Growth Slowest Since COVID-19 PandemicJanuary 27, 2026The decline in international migration was felt across the states, though its impact varied.


