
Share of People Living in Poverty Areas Fell by 6.6 Percentage Points Since First Half of the Decade
The share of the U.S. population living in poverty areas declined in the second half of this decade, dropping below levels a decade earlier, according to recent data.
The U.S. Census Bureau’s 2015-2019 5-year American Community Survey (ACS) shows the percentage of people in the United States living in poverty areas – defined as census tracts where at least 20% of the population lives in poverty – increased between 2005-2009 and 2010-2014. It then decreased in 2015-2019 to a lower level than in 2005-2009.
These changes reflect the broader economic trends of the last decade.
Living in communities with high poverty concentrations exposes residents to several challenges, such as poor housing conditions, limited job opportunities and high crime rates.
The data cover a 15-year period that included both the Great Recession (December 2007 to June 2009) and the subsequent period of economic expansion. Data collection for the 2015-2019 ACS concluded in December 2019, before the COVID-19 pandemic.
Living in communities with high poverty concentrations exposes residents to several challenges, such as poor housing conditions, limited job opportunities and high crime rates. Government programs often target resources to these high-poverty neighborhoods.
Poverty Areas by State and Region
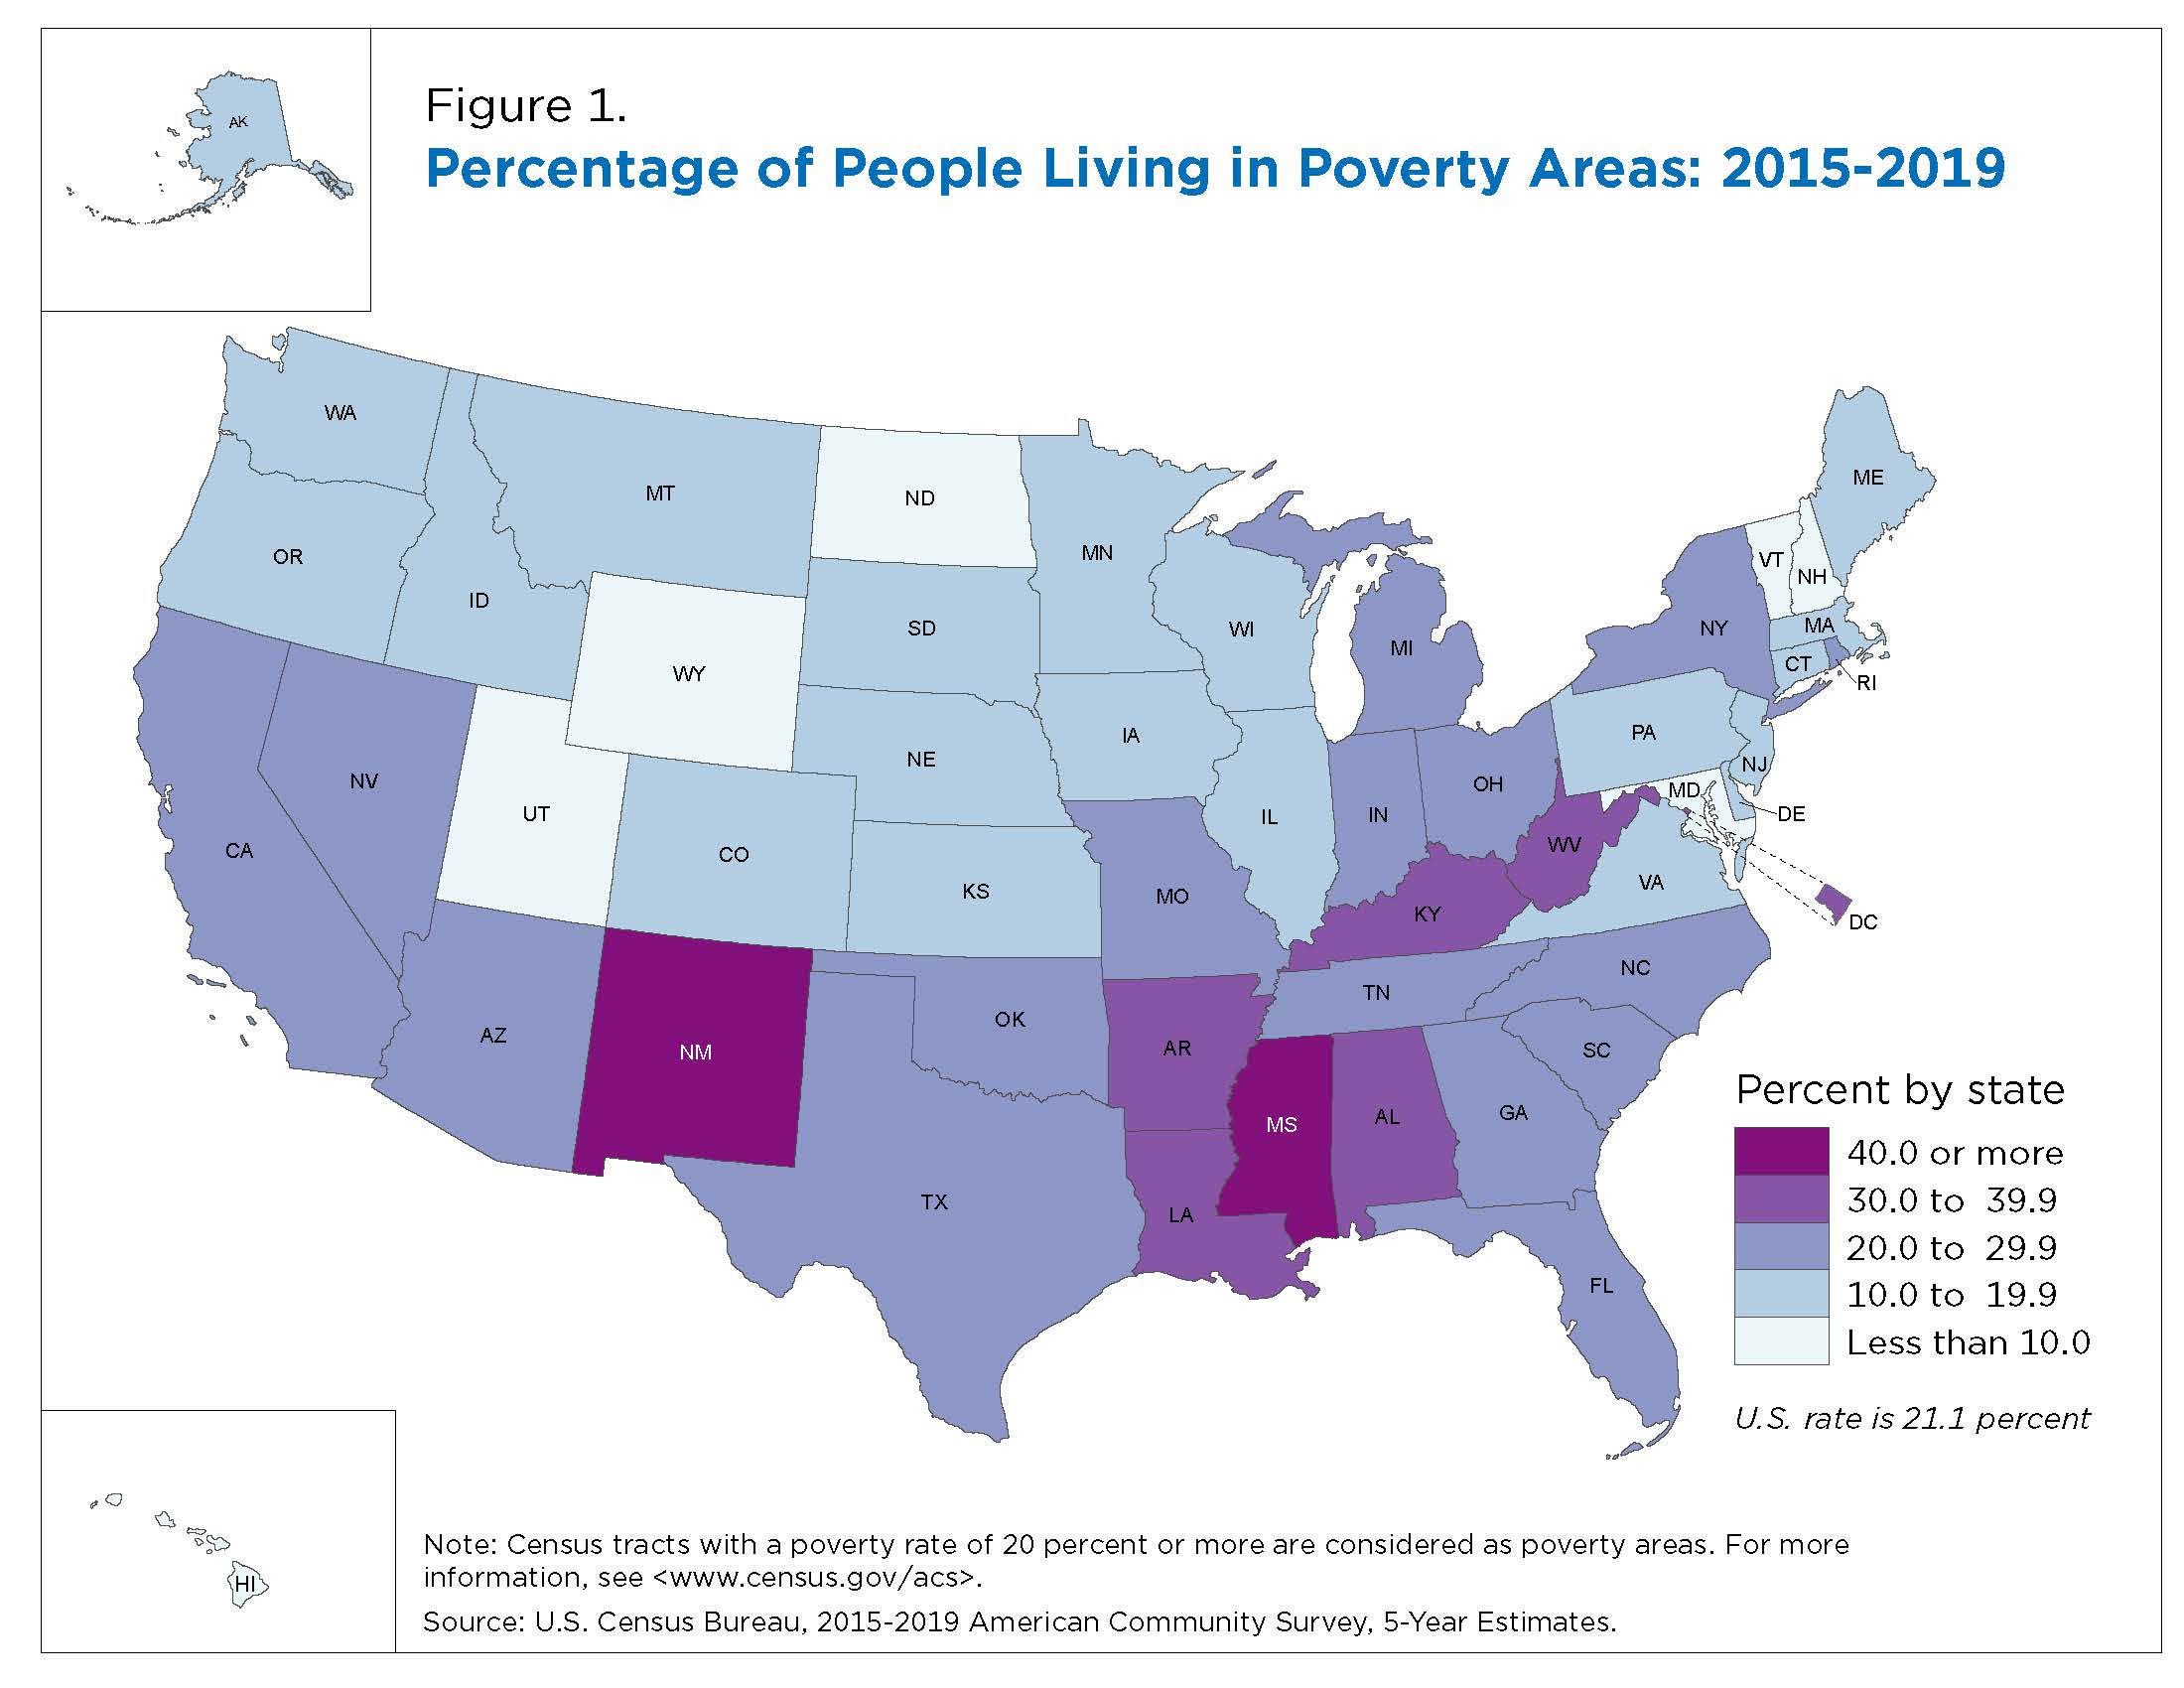
Figure 1 shows the percentage of people living in poverty areas varied in the states with some sharp regional differences.
The Census Bureau defines four regions: Northeast, South, Midwest and West. Six of the seven states with over 30% of their population living in poverty areas were in the South region.
In the 2015-2019 period:
- 21.1% of the U.S. population lived in poverty areas, ranging from a low of 5.2% in New Hampshire to a high of 42.4% in Mississippi.
- In seven states, all in the South except for New Mexico, and the District of Columbia, at least 30% of residents lived in high poverty areas. In Mississippi and New Mexico, at least 40% of people lived in high-poverty areas.
- In seven states, 10% or less of the population lived in poverty areas. These states were spread across the country: three in the West, two in the Northeast, one in the South and one in the Midwest.
The percentage of the U.S. population living in poverty areas changed during the 15-year period stretching from 2005 to 2019.
In the 2005-2009 period, 21.3% of the nation’s population lived in poverty areas. During the 2010-2014 period, this increased by 6.4 percentage points to 27.7%. The rate then declined by 6.6 percentage points to 21.1% in the 2015-2019 period.
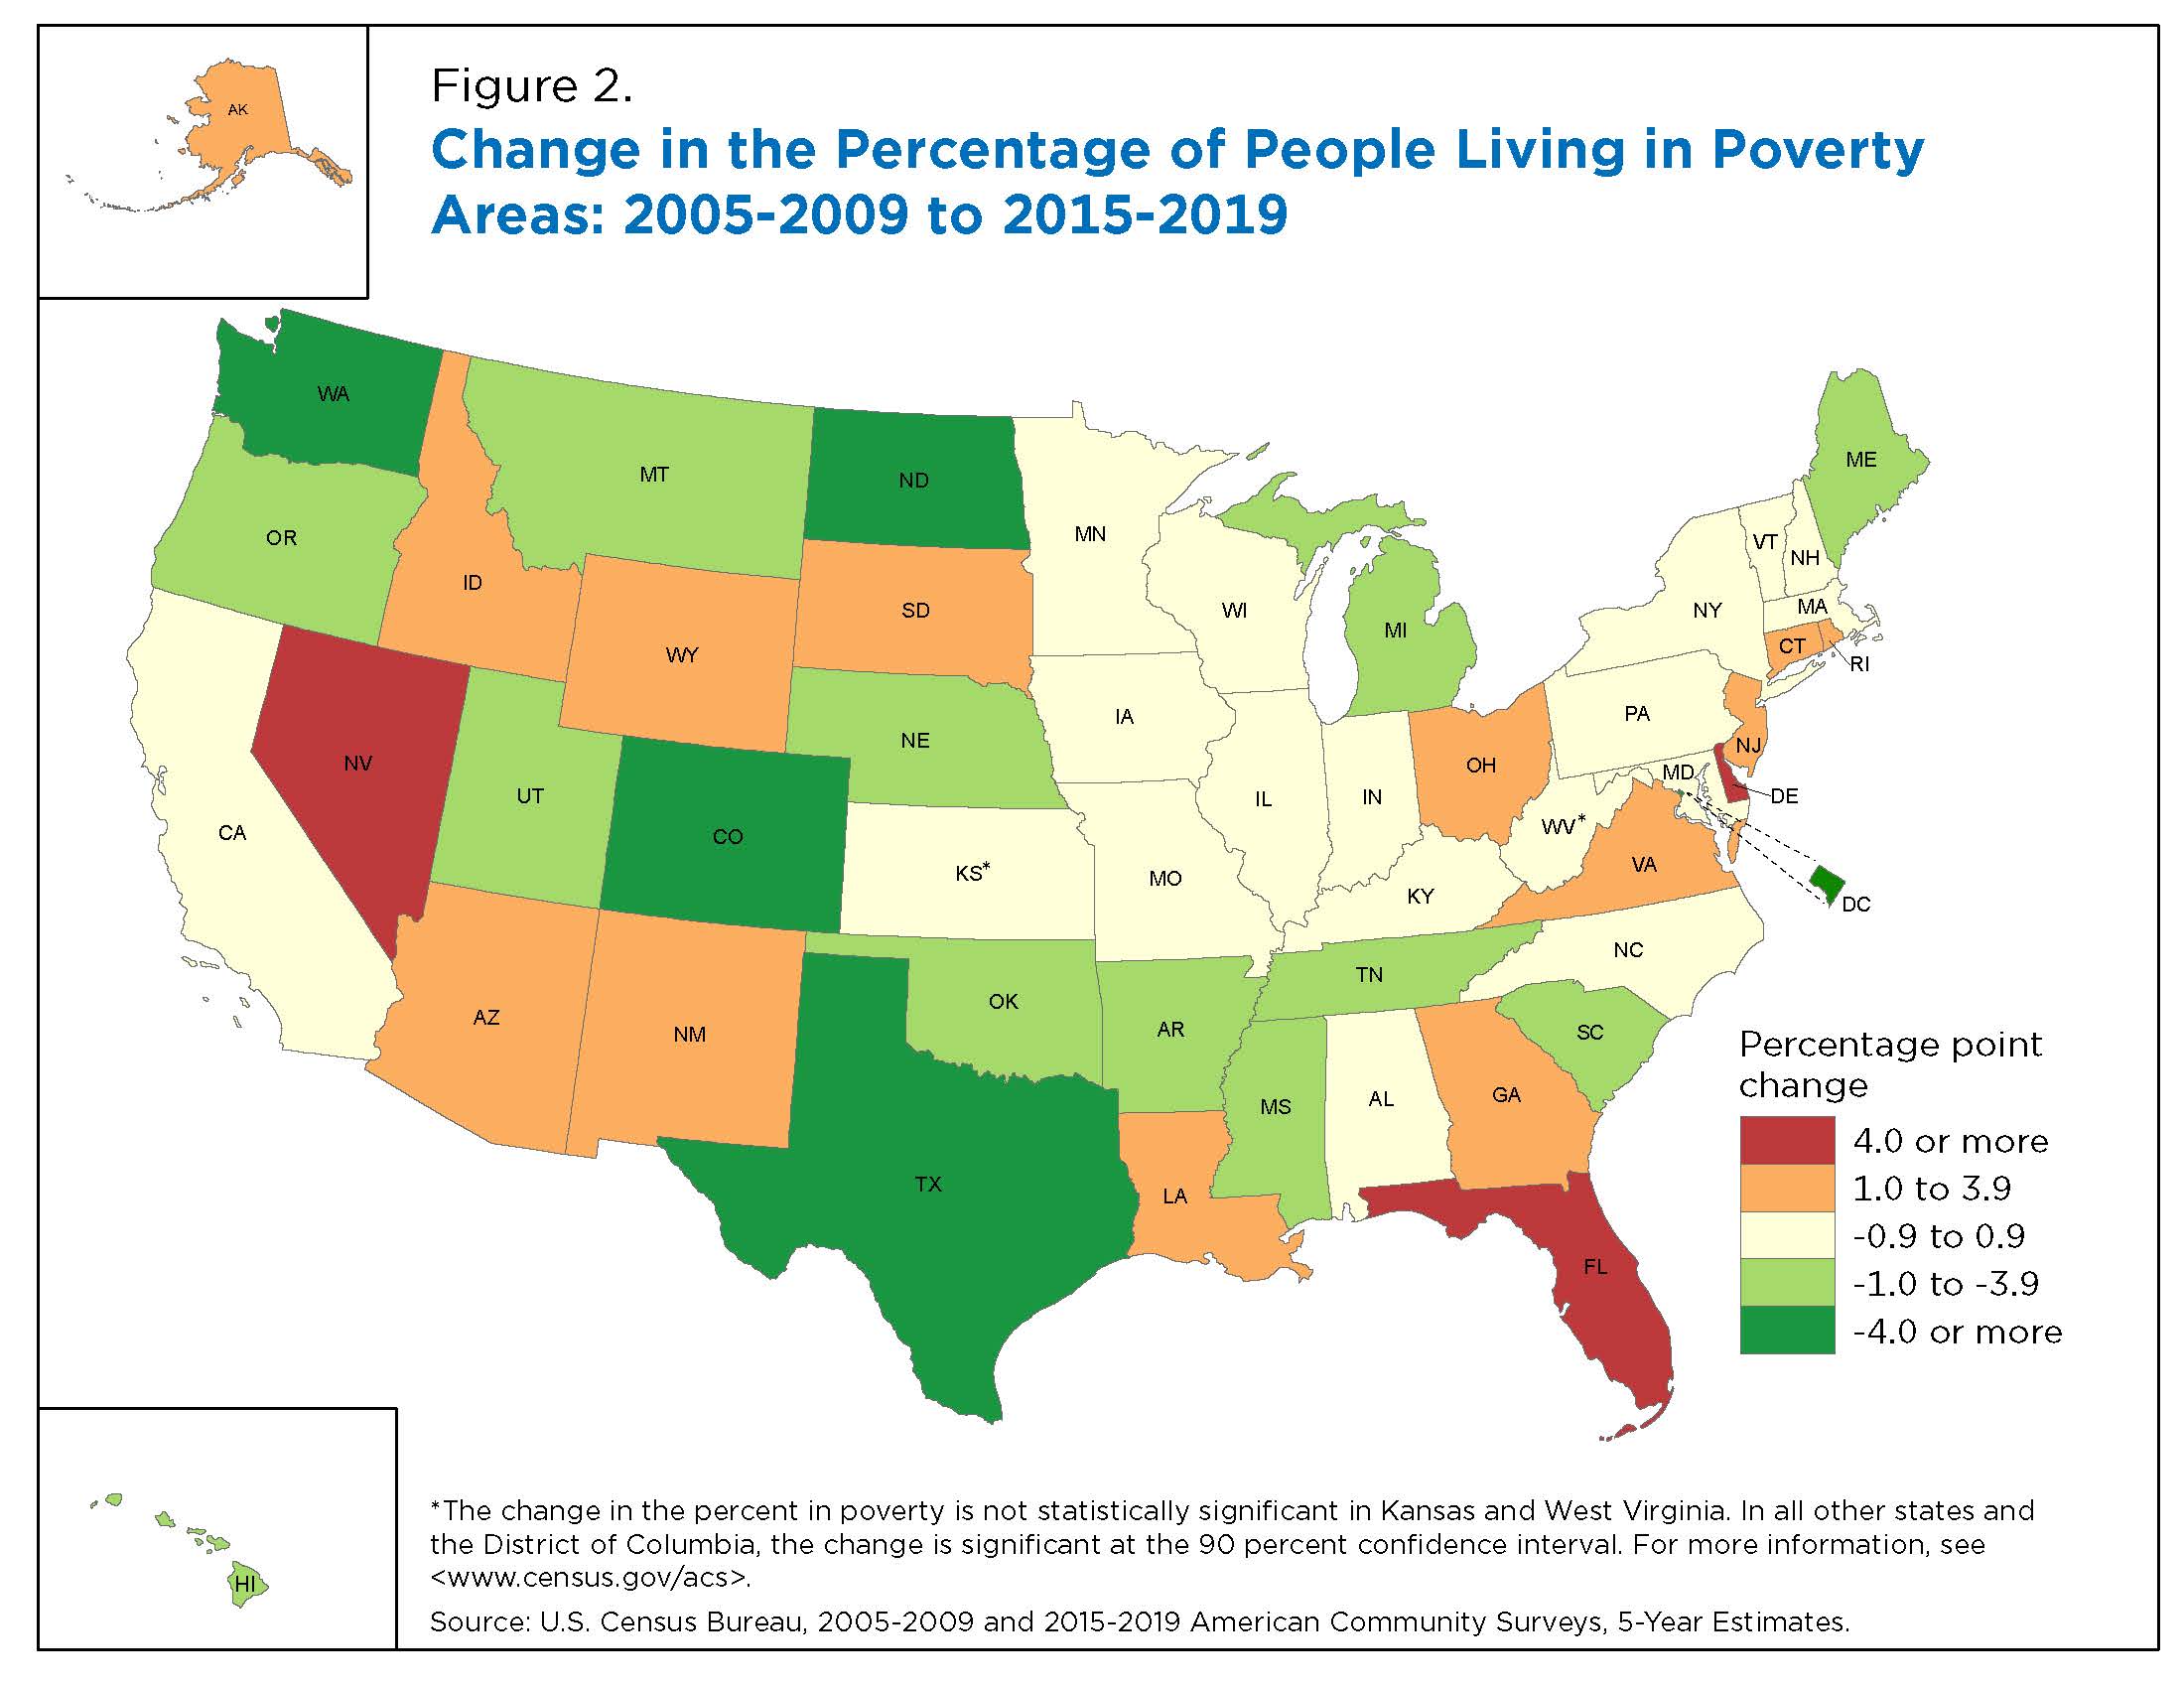
From 2005-2009 to 2015-2019, the percentage of people living in poverty areas in the United States fell by 0.2 percentage points. But there was more variation between these two time periods at the state level (Figure 2).
From 2005-2009 to 2015-2019:
- The percentage of people living in poverty areas increased in 25 states and decreased in 23 states and the District of Columbia. The change was not statistically significant in two states.
- In three states — Nevada, Delaware and Florida —the percentage of the population living in poverty areas rose by more than four percentage points.
- In four states (Washington, North Dakota, Colorado and Texas), the slice of the population living in poverty areas dropped by four percentage points or more.
The report, Changes in Poverty Rates and Poverty Areas Over Time: 2005 to 2019, provides more information on changes in poverty areas in the United States. Percentage of People in Poverty by County: 2015-2019 is an interactive visualization that shows changes in county level poverty rates by Hispanic origin and race.
Em Shrider and Craig Benson are survey statisticians in the Poverty Statistics Branch.
-
Stats for StoriesNational Family Week: November 19-25, 2023In 2022, there were 83.3 million families in the U.S. and average family size had shrunk to 3.11 from 3.20 in 2007, according to the American Community Survey.
-
Stats for StoriesHomeless Persons’ Memorial Day: December 21, 2023HUD reports that on a single night in 2023, roughly 653,100 people in the U.S. experienced homelessness, up about 12 percent from 2022.
Subscribe
Our email newsletter is sent out on the day we publish a story. Get an alert directly in your inbox to read, share and blog about our newest stories.
Contact our Public Information Office for media inquiries or interviews.
-
America Counts StoryPoverty Rates for Blacks and Hispanics Reached Historic Lows in 2019September 15, 2020Black and Hispanic poverty rates reached historic lows of 18.8% and 15.7% respectively in 2019 but inequalities persist.
-
America Counts StoryChildren in Poverty Less Likely to Engage in Sports, Gifted ProgramsSeptember 23, 2020New U.S. Census Bureau survey highlights the impact that poverty has on school-aged children’s involvement in extracurricular activities.
-
America Counts StoryPayday, Poverty, and WomenSeptember 10, 2019Between 2017 and 2018, women working full-time, year-round experienced a significant gain in median earnings but more women than men live in poverty.
-
Families and Living ArrangementsOver a Third of Partners in Opposite-Sex Couples Were the Same AgeApril 27, 2026A new interactive data visualization explores characteristics of opposite-sex married and unmarried couples who lived together in 2025.
-
PopulationEight of the Nation’s Top 15 Last Names Stayed the Same Since 1790April 14, 2026Newly released names data from the 2020 Census show which first and last names are the most popular across the nation.
-
AgeU.S. Population Aging as Nation Turns 250April 09, 2026New population estimates show women still outnumbered men at older ages, but the gap is narrowing due to lower mortality rates and historical factors.
-
Business and EconomyState Lottery Ticket Sales Soar as Prizes Get LargerApril 08, 2026While sales nearly doubled to $104.7 billion from 2008 to 2024, state lottery prizes more than doubled to $70.2 billion in FY 2024.