Texas Counties Enjoy Fastest Growth in Housing Units
The total number of housing units in the United States grew 6.7% between 2010 and 2020 but the growth was not equal across metropolitan and micropolitan areas and beyond and even declined in some areas.
All growth occurred in Core-Based Statistical Areas (CBSAs), which include both metropolitan areas (metros) and micropolitan areas (micros).
While metropolitan counties averaged faster growth than the nation as a whole, not all metro areas gained housing units from 2010 to 2020.
CBSAs are made up of economically connected groups of counties. For example, the Washington-Arlington-Alexandria CBSA includes counties in Maryland, Virginia, Washington D.C., and West Virginia that share a common labor market and have strong commuting ties.
CBSAs with an urban core of at least 10,000 but not more than 50,000 people are classified as micro areas, and those with an urban core of 50,000 or more people as metro areas.
These areas may be further divided into central areas — which contain parts or all the urban core — and outlying areas (outside the urban center).
Some central areas in the Washington-Arlington-Alexandria CBSA are Washington D.C., Montgomery and Prince George’s counties in Maryland, and Arlington and Fairfax counties in Virginia. Some outlying areas are Calvert County, MD, Spotsylvania County, VA, and Jefferson County, WVA.
Housing declined in non-CBSAs, which include all counties located outside of CBSAs.
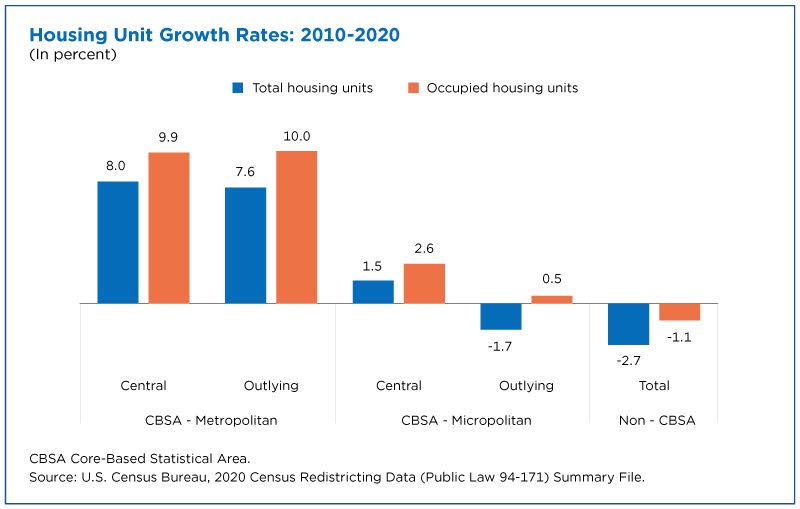
Housing units in central and outlying parts of metropolitan areas, which encompassed about 84.5% of all housing units in 2020, grew more than 7.9% from 2010 to 2020.
Micros and non-CBSAs had less growth and some areas saw dips in the total number of housing units over the decade. Central parts of micropolitan areas experienced a 1.5% increase while outlying pockets of micropolitan areas and non-CBSAs had net losses of 1.7% and 2.7%, respectively.
Impact of Housing Crisis
The number of housing units in an area includes all occupied and vacant units. In 2010, the nation was experiencing a housing crisis, with high numbers of evictions and foreclosures, which resulted in a larger than usual share of vacant housing stock.
The percentage of occupied U.S. housing units increased from 88.6% of all housing units in 2010 to 90.2% in 2020.
The number of occupied housing units grows when new housing is built or previously vacant homes become occupied. It decreases when housing units become vacant, are demolished or are converted into other uses.
The decennial census shows the net change in housing units by occupied and vacant status but does not release numbers on the components of change in the nation’s housing stock. Numbers on the individual components of change in housing stock, such as new construction, demolishment or conversion into nonresidential uses, can be found in the American Housing Survey.
Growth in Occupied Units Outpaces Growth in Total Housing Units in CBSAs
The growth in metros’ central and outlying parts was driven by a 9.9% increase in occupied housing units, which outpaced the 6.7% overall national growth in total housing.
For example, in 2020 there were over 9.1 million more occupied units and 900,000-plus fewer vacant units in central parts of metropolitan areas than in 2010, a net gain of just under 8.2 million (Table 1).
This suggests a tightening of the housing market in metropolitan areas. The growth of occupied units likely came from new construction and previously vacant units that became occupied.
In micropolitan areas, central counties with urban cores experienced a 2.6% jump in occupied units from 2010 to 2020. While smaller than the growth in metropolitan areas, it also outpaced the total growth of housing units in these areas, which was about 1.5%.
Outlying micropolitan counties experienced what seems like a contradictory pattern: They lost housing units overall but showed a small increase (about 0.5%) in occupied housing.
How can the number of housing units decrease but occupied units increase? Because the increase came mostly from vacant housing becoming occupied rather than from more new housing. At the same time, the total housing stock shrank.
Non-CBSAs were the only areas that experienced percentage declines in occupied units over the decade.
Both CBSAs and non-CBSAs experienced declines in the percentage of vacant housing units.
Central parts of metropolitan areas had the lowest overall vacancy rate — 8.3% — in 2020, down 1.6 percentage points from 2010. Even non-CBSAs, which had the highest vacancy rate (21.1%) in 2020, saw a 1.3 percentage point decline in vacant units during the 10-year period.
Overall, these trends suggest a pattern: The largest and most urban areas saw the biggest housing gains while the smallest, lowest density areas outside of CBSAs lost both occupied and vacant housing units.
Non-CBSAs in 2020 represented more than 40.0% of the nation’s counties but had only a 6.5% slice of total U.S. housing units.
Big Gains and Declines in Metropolitan Counties
Because metropolitan areas have larger and denser populations than micropolitan areas and non-CBSAs, even a modest change in counties’ housing unit growth can represent thousands of housing units.
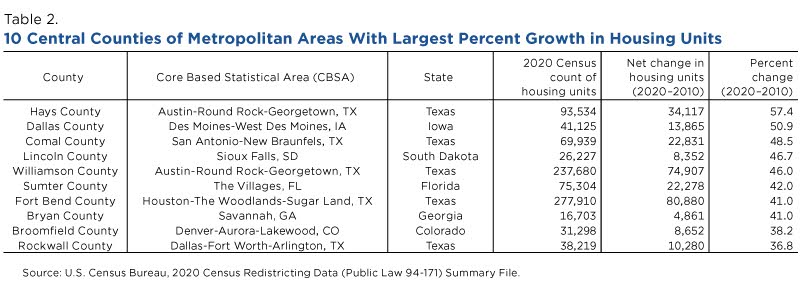
Many of the metro counties with the highest percentage growth in housing units were in Texas (Table 2).
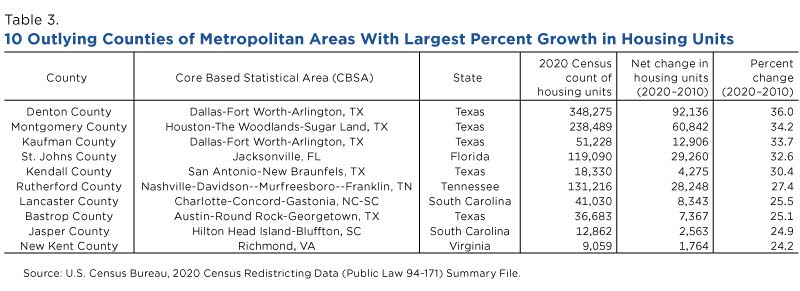
Five of the 10 central counties in metro areas that had the fastest percentage growth in housing units were in Texas. The same is true among outlying metro counties.
Hays County, a central county in the Austin-Round Rock-Georgetown, Texas Metropolitan Area, had a 57.4% increase in housing units between 2010 and 2020, the highest percentage growth of any central metropolitan county in the country and a net gain of over 34,000 units (Table 3).
Denton County, an outlying county in the Dallas-Fort Worth-Arlington, Texas Metropolitan Area, had a 36.0% increase in housing units, the highest percentage growth of any outlying metropolitan county in the country and a net gain of over 92,000 units.
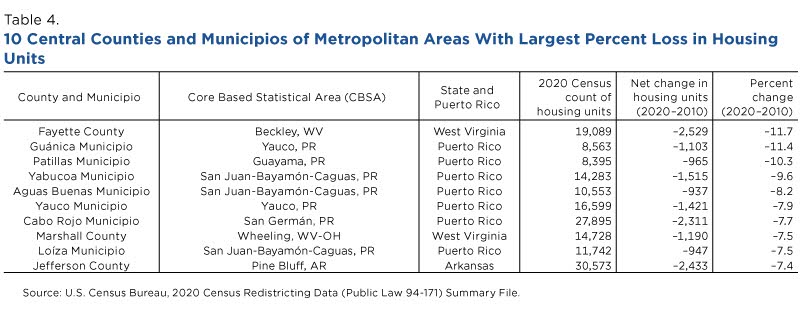
While metropolitan counties averaged faster growth than the nation as a whole, not all metro areas gained housing units from 2010 to 2020. Seven of the 10 central metro counties with the largest declines were in Puerto Rico, two were in West Virginia and one in Arkansas (Table 4).
Fayette County, West Virginia, a central county of the Beckley, West Virginia Metropolitan area, lost 11.7% of its total housing units from 2010 to 2020, the largest percentage loss of any central metropolitan county in the country and a net loss of over 2,500 units.
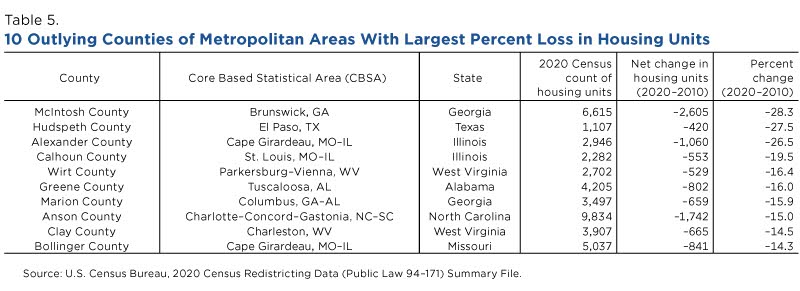
McIntosh County, Georgia, an outlying county of the Brunswick, Georgia metropolitan area, lost 28.3% of its housing units from 2010 to 2020, the largest percentage loss of units of any outlying metropolitan county in the country and a net loss of over 2,600 units (Table 5).
The 2020 Census shows that the metropolitan counties with the largest percentage increases in housing units were primarily in the South, which also experienced the largest population gains.
The metropolitan counties with the largest percentage decreases in housing units were in Puerto Rico and smaller counties in the South and Midwest with a relatively smaller housing stock.
Peter Mateyka is a statistician in the Census Bureau’s Housing Statistics Branch.
Related Statistics
-
Stats for StoriesAmerican Housing Month: June 2023The 2021 American Community Survey counted 142.15M housing units, up 3.61M from 2018, and up 10.36M from 131.79M in 2010.
-
Stats for StoriesWorld Population Day: July 11, 2024The U.S. Census Bureau’s International Database estimates the world population will reach 9 billion in 2037.
Subscribe
Our email newsletter is sent out on the day we publish a story. Get an alert directly in your inbox to read, share and blog about our newest stories.
Contact our Public Information Office for media inquiries or interviews.
-
America Counts StoryZillow and Census Bureau Data Show Pandemic’s Impact on Housing MarketOctober 04, 2021The housing market stalled in spring 2020 but rebounded by summer.
-
America Counts StoryGrowth in Housing Units Slowed in the Last DecadeAugust 12, 2021The 2020 Census results released today provide a count of vacant and occupied housing units across the nation.
-
America Counts StoryU.S. Housing Vacancy Rate Declined in Past DecadeAugust 12, 2021The percentage of housing units vacant in 2020 dropped to 9.7% from 11.4% in 2010, according to 2020 Census data released this week.
-
Business and EconomyWhat Is the Nonemployer Marine Economy?April 09, 2025Thirty states had nonemployer businesses in marine economy sectors, including six states in the Midwest with receipts totaling nearly $11 billion in 2022.
-
Business and EconomyEconomic Census Geographic Area Statistics Data Now AvailableApril 07, 2025A new data visualization based on the 2022 Economic Census shows the changing business landscape of 19 economic sectors across the United States.
-
Income and PovertyWhat Sources of Income Do People Rely On?April 02, 2025A new interactive data tool shows income sources for hundreds of demographic and economic characteristic combinations.
-
Business and EconomyBig Improvements to the Annual Integrated Economic Survey (AIES)March 26, 2025The Census Bureau is making several changes and enhancements to capture 2024 economic data based on feedback from last year’s survey.


