
Official websites use .gov
A .gov website belongs to an official government organization in the United States.
Secure .gov websites use HTTPS
A lock (
) or https:// means you’ve safely connected to the .gov website. Share sensitive information only on official, secure websites.

Topics
Data & Maps
Surveys & Programs
Resource Library
2021 Capital Spending Report: U.S. Capital Spending Patterns 2010-2019
2021 Capital Spending Report: U.S. Capital Spending Patterns 2010-2019
Data in this report are from the Census Bureau's Annual Capital Expenditures Survey (ACES), which collects information on expenditures for new and used structures and equipment by all U.S. nonfarm businesses. The Capital Spending Report series covers spending by North American Industry Classification System (NAICS) industry sector in a ten-year moving window ending with the most recent ACES reference year— 2019 in the current report. However, linked background tables provide comparable NAICS industry data beginning in 1999. Estimates for the most recent years in each report are subject to revision.
The report looks closely at investment shares over time to see which are growing (shrinking) and, in theory, where firms and capital markets perceive the greatest economic opportunity. Annual spending estimates are not adjusted for inflation. This may affect the utility of year-to-year or longer-term comparisons of spending levels, especially when inflation rates are volatile and vary across industry groups and asset categories. However, with some exceptions (e.g., declines in information technology equipment prices, which may have a negative effect on investment totals in industries that invest heavily in IT equipment), comparisons of shares of overall investment across industry groups are less affected by inflation.
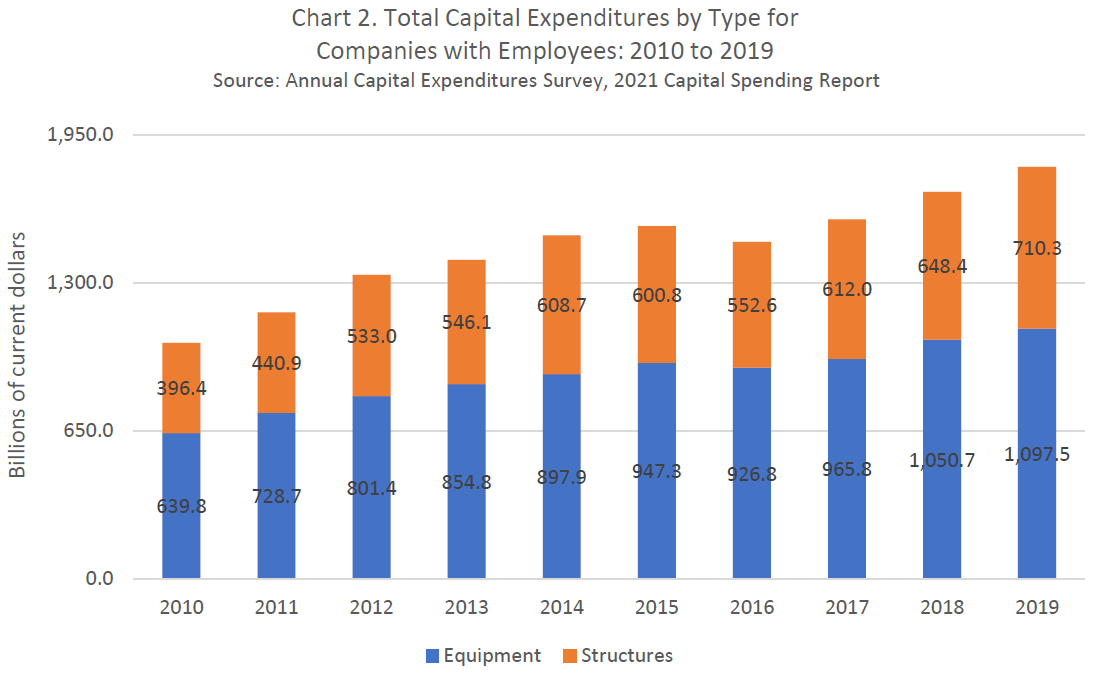
The ACES collects industry detail only for companies with employees; hence, estimates in the present report series of capital spending by industry are for employer businesses. Over the 10-year period from 2010 to 2019, these businesses accounted for over ninety percent of total annual structures and equipment spending by U.S. nonfarm businesses.
Summary Highlights of Total Capital Spending
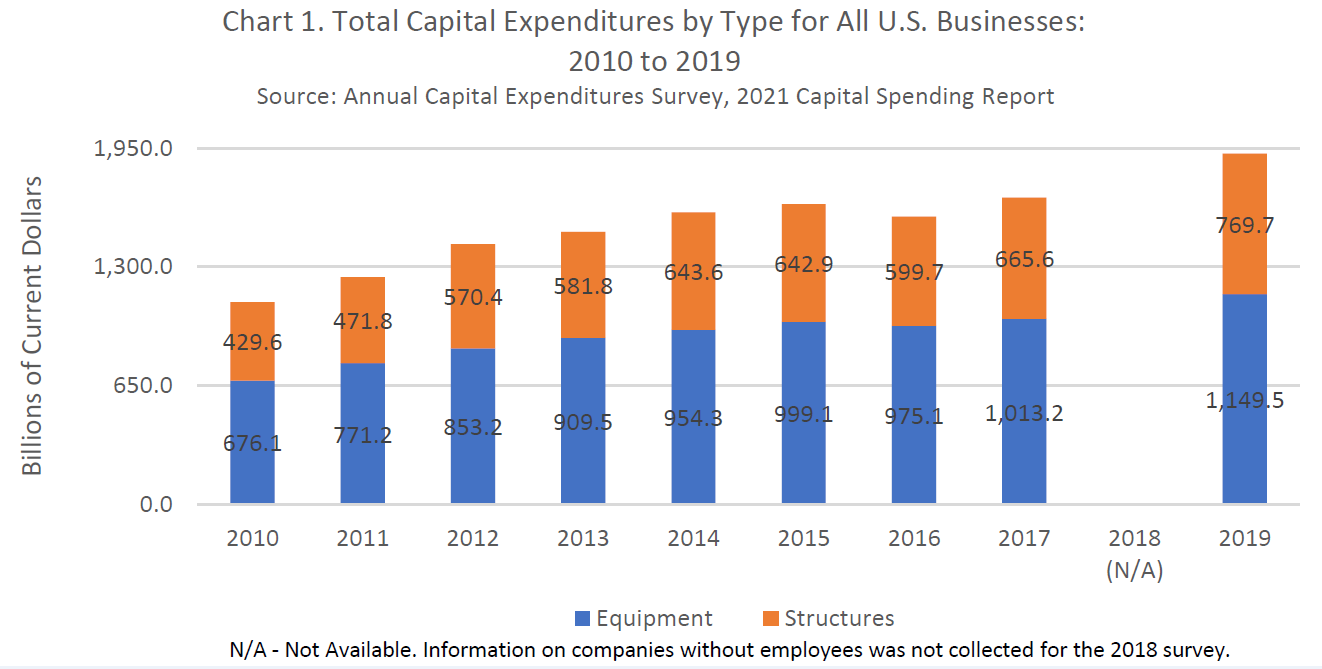
Between 2010 and 2019, the period covered by this report, total spending by U.S. nonfarm businesses increased $813.5 billion (73.6 percent) from $1,105.7 billion in 2010 to $1,919.2 billion in 2019.
- At the end of the 10-year period from 2010 to 2019, capital spending for structures had reached a high of $769.7 billion, an increase of $340.1 billion (79.2 percent) from 2010 spending.
- At the end of the 10-year period from 2010 to 2019, equipment expenditures totaled $1,149.5 billion, an increase of $473.4 billion (70.0 percent) from 2010 spending.
Sector Highlights
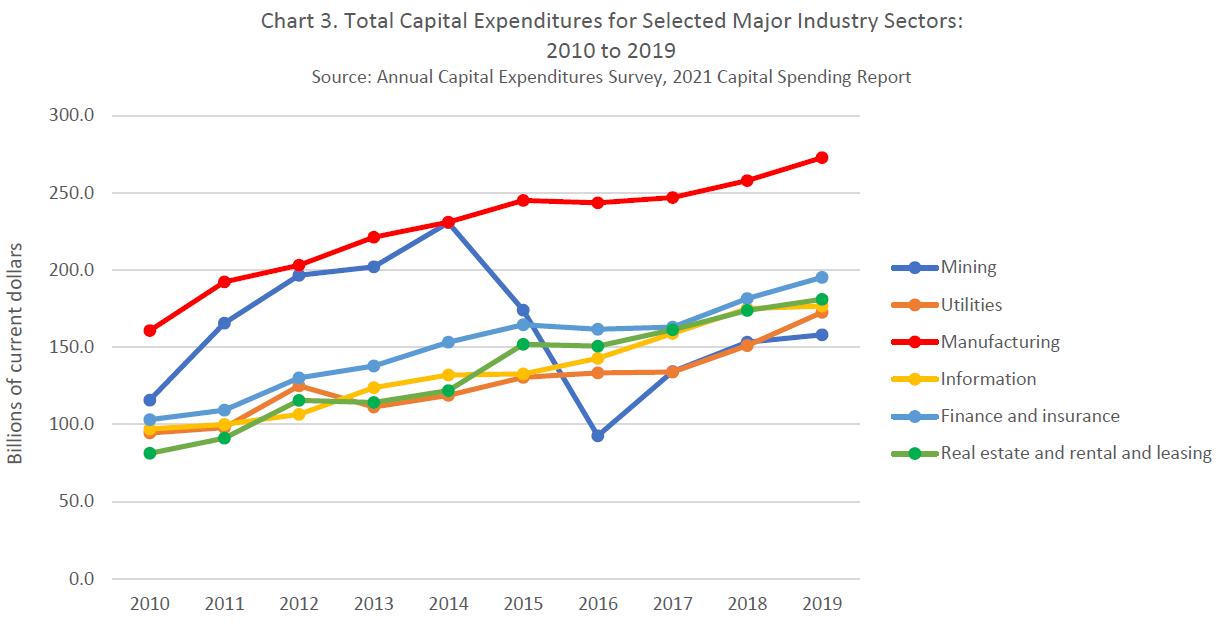
- The transportation and warehousing sector’s share of capital expenditures increased from 5.7 percent to 7.1 percent from 2010 to 2019.
- The finance and insurance sector’s share of capital expenditures increased from 9.9 percent to 10.8 percent from 2010 to 2019.
- The real estate and rental and leasing sector’s share of capital expenditures increased from 7.8 percent to 10.0 percent over the 10-year period.
- The mining sector’s share of capital expenditures decreased from 11.2 percent to 8.7 percent from 2010 to 2019.
- The wholesale trade sector’s share of capital expenditures decreased from 3.0 percent to 2.2 percent from 2010 to 2019.
- The retail trade sector’s share of capital expenditures decreased from 6.3 percent to 5.5 percent from 2010 to 2019.
- The health care and social assistance sector’s share of capital expenditures decreased from 7.6 percent to 6.5 percent from 2010 to 2019.
General Highlights
- In 2010, capital spending by all U.S. nonfarm businesses totaled $1,105.7 billion. Capital investments increased for the next five years, 12.4 percent in 2011, 14.5 percent in 2012, 4.8 percent in 2013, 7.1 percent in 2014, and 2.8 percent in 2015. In 2016, capital spending decreased 4.1 percent but then increased 6.6 percent in 2017. Companies with no employees were excluded from the 2018 sample, therefore, the change in total capital spending cannot be determined between 2018 and 2019. At the end of the 10-year period from 2010 to 2019, total capital expenditures totaled $1,919.2 billion, an increase of $813.5 billion (73.6 percent) from 2010 spending.
- In 2010, expenditures for structures totaled $429.6 billion. Of this amount, $395.4 billion (92.0 percent) was spending for new structures. Spending increased in 2011 by 9.8 percent and in 2012 by 20.9 percent. Spending showed no significant change in 2013 but then increased 10.6 percent in 2014. Spending showed no significant change in 2015. Capital investment in structures decreased 6.7 percent in 2016 but then increased by 11.0 percent in 2017. Companies with no employees were excluded from the 2018 sample, therefore, the change in total capital spending cannot be determined between 2018 and 2019. At the end of the 10-year period from 2010 to 2019, capital spending for structures had reached a high of $769.7 billion, an increase of $340.1 billion (79.2 percent) from 2010 spending.
- In 2010, equipment expenditures totaled $676.1 billion. Of this amount, $638.3 billion (94.4 percent) was spending for new equipment. Spending for equipment increased for the next five years, 14.1 percent in 2011, 10.6 percent in 2012, 6.6 percent in 2013, 4.9 percent in 2014, and 4.7 percent in 2015. Capital investment in equipment decreased 2.4 percent in 2016 but then increased 3.9 percent in 2017. Companies with no employees were excluded from the 2018 sample, therefore, the change in total capital spending cannot be determined between 2018 and 2019. At the end of the 10-year period from 2010 to 2019, equipment expenditures totaled $1,149.5 billion, an increase of $473.4 billion (70.0 percent) from 2010 spending.
Click to enlarge.
*These data are subject to sampling/non-sampling error.
Click to enlarge.
*These data are subject to sampling/non-sampling error.
Sector Highlights for Companies with Employees:
- Sectors showing the largest absolute increases in their capital investments from 2010 to 2019 included mining (up $42.3 billion or 36.5 percent), utilities (up $78.2 billion or 82.8 percent), manufacturing (up $112.1 billion or 69.7 percent), retail trade (up $33.3 billion or 51.1 percent), transportation and warehousing (up $69.6 billion or 118.0 percent), information (up $79.6 billion or 81.9 percent), finance and insurance (up $92.2 billion or 89.5 percent), real estate and rental and leasing (up $99.9 billion or 122.9 percent), and health care and social assistance (up $38.4 billion or 48.9 percent).
- No sectors showed a statistically significant decrease in their capital investments over the 10-year period from 2010 - 2019.
Click to enlarge.
*These data are subject to sampling/non-sampling error.
Accommodation and Food Services

* These data are subject to sampling/non-sampling error.
Administrative and Support and Waste Management

* These data are subject to sampling/non-sampling error.
Arts, Entertainment, and Recreation

* These data are subject to sampling/non-sampling error.
Construction

* These data are subject to sampling/non-sampling error.
Educational Services

* These data are subject to sampling/non-sampling error.
Finance and insurance

* These data are subject to sampling/non-sampling error.
Forestry, Fishing, and Agricultural Services

* These data are subject to sampling/non-sampling error.
Health Care and Social Assistance

* These data are subject to sampling/non-sampling error.
Information

* These data are subject to sampling/non-sampling error.
Management of Companies and Enterprises

* These data are subject to sampling/non-sampling error.
Manufacturing

* These data are subject to sampling/non-sampling error.
Mining

* These data are subject to sampling/non-sampling error.
Other Services (Except Public Administration)

* These data are subject to sampling/non-sampling error.
Professional, Scientific, and Technical Services

* These data are subject to sampling/non-sampling error.
Real Estate and Rental and Leasing

* These data are subject to sampling/non-sampling error.
Retail Trade

* These data are subject to sampling/non-sampling error.
Transportation and Warehousing

* These data are subject to sampling/non-sampling error.
Utilities

* These data are subject to sampling/non-sampling error.
Wholesale Trade

* These data are subject to sampling/non-sampling error.


Source Information
Related Information
Page Last Revised - December 16, 2021
✕
Is this page helpful?
 Yes
Yes
 No
No
 Yes
Yes
 No
No✕
NO THANKS
255 characters maximum
 255 characters maximum reached
✕
Thank you for your feedback.
Comments or suggestions?

Comments or suggestions?