
Official websites use .gov
A .gov website belongs to an official government organization in the United States.
Secure .gov websites use HTTPS
A lock (
) or https:// means you’ve safely connected to the .gov website. Share sensitive information only on official, secure websites.

Topics
Data & Maps
Surveys & Programs
Resource Library
Annual Capital Expenditures: 2019
Annual Capital Expenditures: 2019
Summary of Findings
General highlights
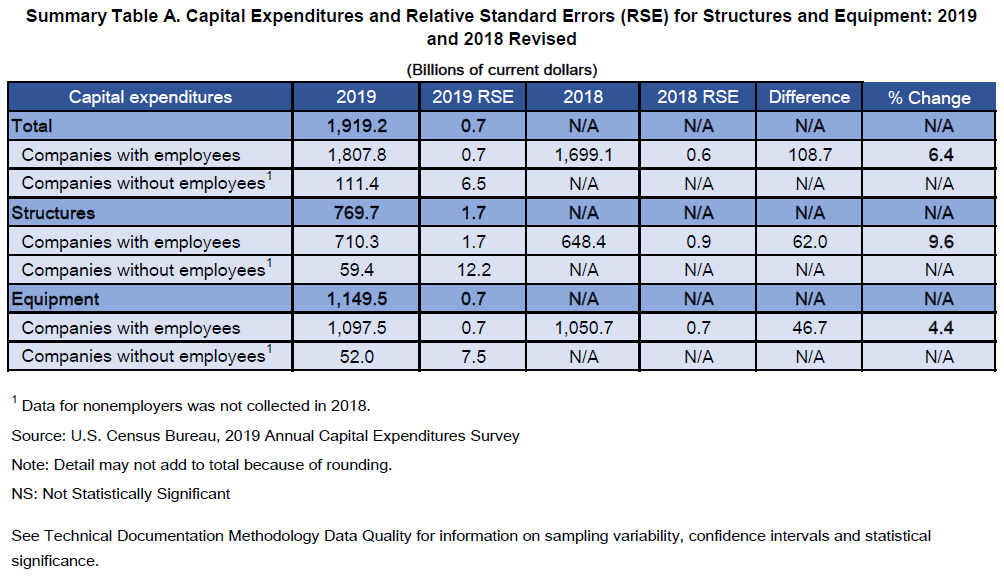
In 2019, U.S. nonfarm businesses with and without employees invested $1,919.2 billion in new and used structures and equipment. Companies with employees accounted for $1,807.8 billion (94.5 percent) and companies without employees accounted for $111.4 billion (5.8 percent) of capital spending in 2019. (See Summary Table A below, and Tables 1a and 1b).
Capital expenditures for companies without employees was not collected for the 2018 survey.
Click to enlarge.
Companies with employees
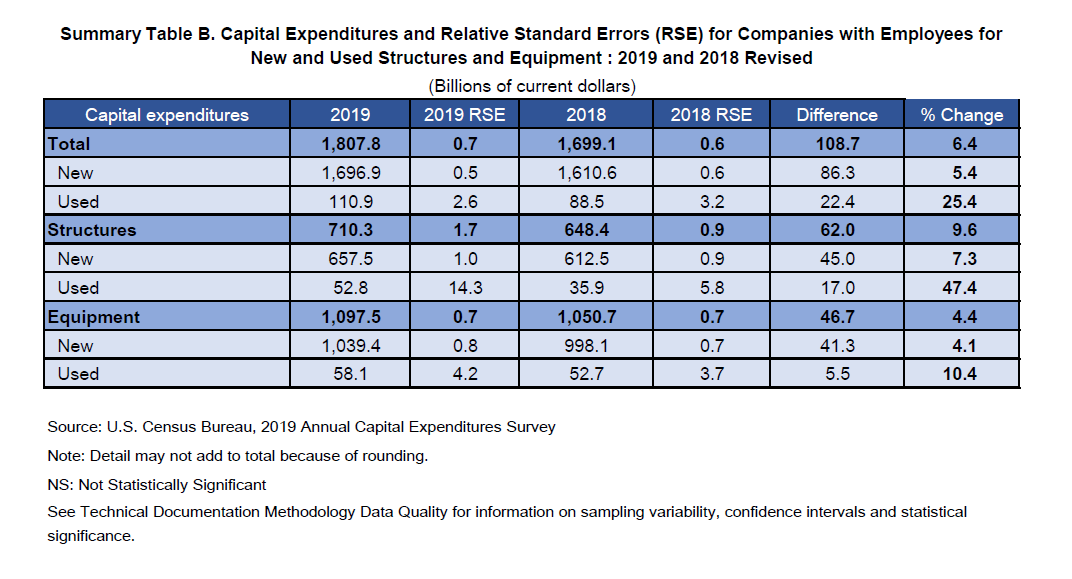
In 2019, U.S. nonfarm employer businesses invested $1,807.8 billion in new and used structures and equipment, an increase of $108.7 billion (6.4 percent) from the revised 2018 employer total of $1,699.1 billion. Total spending on new structures and new equipment was $1,696.9 billion, an increase of $86.3 (5.4 percent) from the revised 2018 total of $1,610.6 billion. (See Summary Table B below, and Tables 1a and 1b).
Expenditures on new and used structures totaled $710.3 billion in 2019, up $62.0 billion (9.6 percent) from 2018 (See Figure 1). Of this amount, $657.5 billion (92.6 percent) was spent for new structures, an increase of $45.0 billion (7.3 percent) from 2018. Expenditures for used structures totaled $52.8 billion.
Spending on new and used equipment totaled $1,097.5 billion in 2019, up $46.7 billion (4.4 percent) from 2018. Of this amount, $1,039.4 billion (94.7 percent) was for new equipment, an increase of $41.3 billion (4.1 percent) from 2018. Expenditures for used equipment totaled $52.8 billion (about 7.4 percent of total structure spending), an increase of $17.0 billion (47.4 percent) from 2018. (See Figure 2).
Click to enlarge
Highlights by business sector for companies with employees (See Tables 2, 3, and 4)
(Data in this section is based on the 2012 North American Industry Classification System. Data is only for companies with employees because companies without employees are not asked to report capital expenditures by sector or industry.)
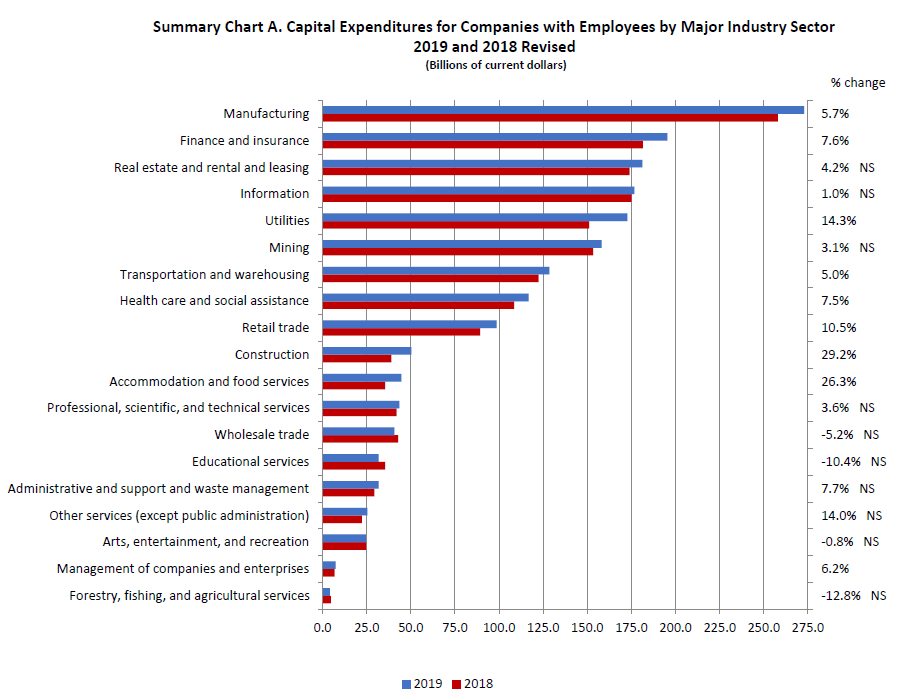
Of the 19 NAICS major industry sectors covered in this report, 9 had a statistically significant increase in capital spending in 2019 compared with 2018, and 10 showed no statistically significant change. The values of structures and equipment may not sum to the values of total capital expenditures due to rounding (See Summary Chart A below, Figure 3 and Figure 4).
Based on 130 industries shown in this report, 42 had a statistically significant increase in spending, 18 had a statistically significant decrease, 70 showed no significant change from the prior year.
Click to enlarge
| Source: U.S. Census Bureau, 2019 Annual Capital Expenditures Survey Note: Detail may not add to total because of rounding. NS: Not Statistically Significant See Technical Documentation Methodology Data Quality for information on sampling variability, confidence intervals and statistical significance. |
Manufacturing
Capital Expenditures for Structures and Equipment for Companies with Employees: 2019 and 2018 Revised (Billions of current dollars) |
|||||
|---|---|---|---|---|---|
Capital expenditures |
2019 |
2018 |
% Change |
||
Total Manufacturing |
272.9 |
258.1 |
5.7% |
|
|
Structures |
65.5 |
58.9 |
11.2% |
||
Equipment |
207.4 |
199.2 |
4.1% |
|
|
Durable Goods Industries |
141.4 |
137.8 |
2.6% |
NS |
|
Structures |
27.6 |
26.3 |
4.8% |
NS |
|
Equipment |
113.8 |
111.4 |
2.1% |
NS |
|
Nondurable Goods Industries |
131.5 |
120.3 |
9.3% |
||
Structures |
37.9 |
32.6 |
16.3% |
||
Equipment |
93.6 |
87.7 |
6.7% |
|
|
| Source: U.S. Census Bureau, 2019 Annual Capital Expenditures Survey Note: Detail may not add to total because of rounding. NS: Not Statistically Significant See Technical Documentation Methodology Data Quality for information on sampling variability, confidence intervals and statistical significance. |
|||||

Finance and Insurance
Capital Expenditures for Structures and Equipment for Companies with Employees: 2019 and 2018 Revised (Billions of current dollars) |
|||||
|---|---|---|---|---|---|
Capital expenditures |
2019 |
2018 |
% Change |
||
Total Finance and Insurance |
195.3 |
181.5 |
7.6% |
|
|
Structures |
31.8 |
25.6 |
24.5% |
||
Equipment |
163.5 |
156.0 |
4.8% |
NS |
|
| Source: U.S. Census Bureau, 2019 Annual Capital Expenditures Survey Note: Detail may not add to total because of rounding. NS: Not Statistically Significant See Technical Documentation Methodology Data Quality for information on sampling variability, confidence intervals and statistical significance. |
|||||
Information
Capital Expenditures for Structures and Equipment for Companies with Employees: 2019 and 2018 Revised (Billions of current dollars) |
|||||
|---|---|---|---|---|---|
Capital expenditures |
2019 |
2018 |
% Change |
||
Total Information |
176.8 |
175.1 |
1.0% |
NS |
|
Structures |
51.4 |
43.5 |
18.3% |
||
Equipment |
125.3 |
131.6 |
-4.8% |
||
| Source: U.S. Census Bureau, 2019 Annual Capital Expenditures Survey Note: Detail may not add to total because of rounding. NS: Not Statistically Significant See Technical Documentation Methodology Data Quality for information on sampling variability, confidence intervals and statistical significance. |
|||||
Real Estate and Rental and Leasing
Capital Expenditures for Structures and Equipment for Companies with Employees: 2019 and 2018 Revised (Billions of current dollars) |
|||||
|---|---|---|---|---|---|
Capital expenditures |
2019 |
2018 |
% Change |
||
Total Real Estate and Rental and Leasing |
181.2 |
173.9 |
4.2% |
NS |
|
Structures |
72.6 |
70.5 |
3.0% |
NS |
|
Equipment |
108.6 |
103.4 |
5.0% |
NS |
|
| Source: U.S. Census Bureau, 2019 Annual Capital Expenditures Survey Note: Detail may not add to total because of rounding. NS: Not Statistically Significant See Technical Documentation Methodology Data Quality for information on sampling variability, confidence intervals and statistical significance. |
|||||
Mining
Capital Expenditures for Structures and Equipment for Companies with Employees: 2019 and 2018 Revised (Billions of current dollars) |
|||||
|---|---|---|---|---|---|
Capital expenditures |
2019 |
2018 |
% Change |
||
Total Mining |
158.1 |
153.4 |
3.1% |
NS |
|
Structures |
114.6 |
114.1 |
0.5% |
NS |
|
Equipment |
43.4 |
39.3 |
10.5% |
NS |
|
| Source: U.S. Census Bureau, 2019 Annual Capital Expenditures Survey Note: Detail may not add to total because of rounding. NS: Not Statistically Significant See Technical Documentation Methodology Data Quality for information on sampling variability, confidence intervals and statistical significance. |
|||||
Utilities
Capital Expenditures for Structures and Equipment for Companies with Employees: 2019 and 2018 Revised (Billions of current dollars) |
|||||
|---|---|---|---|---|---|
Capital expenditures |
2019 |
2018 |
% Change |
||
Total Utilities |
172.6 |
151.0 |
14.3% |
|
|
Structures |
90.7 |
78.3 |
15.8% |
||
Equipment |
82.0 |
72.7 |
12.7% |
||
| Source: U.S. Census Bureau, 2019 Annual Capital Expenditures Survey Note: Detail may not add to total because of rounding. NS: Not Statistically Significant See Technical Documentation Methodology Data Quality for information on sampling variability, confidence intervals and statistical significance. |
|||||
Transportation and Warehousing
Capital Expenditures for Structures and Equipment for Companies with Employees: 2019 and 2018 Revised (Billions of current dollars) |
|||||
|---|---|---|---|---|---|
Capital expenditures |
2019 |
2018 |
% Change |
||
Total Transportation and Warehousing |
128.5 |
122.4 |
5.0% |
|
|
Structures |
52.7 |
44.6 |
18.0% |
||
Equipment |
75.9 |
77.7 |
-2.4% |
NS |
|
| Source: U.S. Census Bureau, 2019 Annual Capital Expenditures Survey Note: Detail may not add to total because of rounding. NS: Not Statistically Significant See Technical Documentation Methodology Data Quality for information on sampling variability, confidence intervals and statistical significance. |
|||||
Health Care and Social Assistance
Capital Expenditures for Structures and Equipment for Companies with Employees: 2019 and 2018 Revised (Billions of current dollars) |
|||||
|---|---|---|---|---|---|
Capital expenditures |
2019 |
2018 |
% Change |
||
Total Health Care and Social Assistance |
116.7 |
108.6 |
7.5 |
||
Structures |
69.3 |
59.9 |
15.8 |
||
Equipment |
47.4 |
48.7 |
-2.6 |
NS |
|
| Source: U.S. Census Bureau, 2019 Annual Capital Expenditures Survey Note: Detail may not add to total because of rounding. NS: Not Statistically Significant See Technical Documentation Methodology Data Quality for information on sampling variability, confidence intervals and statistical significance. |
|||||
Retail Trade
Capital Expenditures for Structures and Equipment for Companies with Employees: 2019 and 2018 Revised (Billions of current dollars) |
|||||
|---|---|---|---|---|---|
Capital expenditures |
2019 |
2018 |
% Change |
||
Total Retail Trade |
98.6 |
89.2 |
10.5% |
|
|
Structures |
42.8 |
38.9 |
10.2% |
|
|
Equipment |
55.8 |
50.4 |
10.7% |
|
|
| Source: U.S. Census Bureau, 2019 Annual Capital Expenditures Survey Note: Detail may not add to total because of rounding. NS: Not Statistically Significant See Technical Documentation Methodology Data Quality for information on sampling variability, confidence intervals and statistical significance. |
|||||
Professional, scientific, and technical services
Capital Expenditures for Structures and Equipment for Companies with Employees: 2018 and 2017 Revised (Billions of current dollars) |
|||||
|---|---|---|---|---|---|
Capital expenditures |
2019 |
2018 |
% Change |
||
Total Professional, scientific, and technical services |
43.5 |
42.0 |
3.6% |
NS |
|
Structures |
13.1 |
13.6 |
-3.9% |
NS |
|
Equipment |
30.5 |
28.4 |
7.2% |
NS |
|
| Source: U.S. Census Bureau, 2019 Annual Capital Expenditures Survey Note: Detail may not add to total because of rounding. NS: Not Statistically Significant See Technical Documentation Methodology Data Quality for information on sampling variability, confidence intervals and statistical significance. |
|||||
Wholesale Trade
Capital Expenditures for Structures and Equipment for Companies with Employees: 2019 and 2018 Revised (Billions of current dollars) |
|||||
|---|---|---|---|---|---|
Capital expenditures |
2019 |
2018 |
% Change |
||
Total Wholesale Trade |
40.6 |
42.8 |
-5.2% |
NS |
|
Structures |
10.1 |
12.8 |
-20.7% |
|
|
Equipment |
30.5 |
30.0 |
1.4% |
NS |
|
| Source: U.S. Census Bureau, 2019 Annual Capital Expenditures Survey Note: Detail may not add to total because of rounding. NS: Not Statistically Significant See Technical Documentation Methodology Data Quality for information on sampling variability, confidence intervals and statistical significance. |
|||||
Construction
Capital Expenditures for Structures and Equipment for Companies with Employees: 2019 and 2018 Revised (Billions of current dollars) |
|||||
|---|---|---|---|---|---|
Capital expenditures |
2019 |
2018 |
% Change |
||
Total Construction |
50.4 |
39.0 |
29.2% |
|
|
Structures |
7.7 |
4.0 |
89.8% |
|
|
Equipment |
42.7 |
34.9 |
22.2% |
|
|
| Source: U.S. Census Bureau, 2019 Annual Capital Expenditures Survey Note: Detail may not add to total because of rounding. NS: Not Statistically Significant See Technical Documentation Methodology Data Quality for information on sampling variability, confidence intervals and statistical significance. |
|||||
Educational services
Capital Expenditures for Structures and Equipment for Companies with Employees: 2019 and 2018 Revised (Billions of current dollars) |
|||||
|---|---|---|---|---|---|
Capital expenditures |
2019 |
2018 |
% Change |
||
Total Educational services |
31.8 |
35.5 |
-10.4% |
NS |
|
Structures |
25.0 |
29.1 |
-14.0% |
NS |
|
Equipment |
6.8 |
6.4 |
6.1% |
NS |
|
| Source: U.S. Census Bureau, 2019 Annual Capital Expenditures Survey Note: Detail may not add to total because of rounding. NS: Not Statistically Significant See Technical Documentation Methodology Data Quality for information on sampling variability, confidence intervals and statistical significance. |
|||||
Accommodation and food services
Capital Expenditures for Structures and Equipment for Companies with Employees: 2019 and 2018 Revised (Billions of current dollars) |
|||||
|---|---|---|---|---|---|
Capital expenditures |
2019 |
2018 |
% Change |
||
Total Accommodation and food services |
44.7 |
35.4 |
26.3% |
|
|
Structures |
22.0 |
17.4 |
26.6% |
NS |
|
Equipment |
22.7 |
18.0 |
26.1% |
|
|
| Source: U.S. Census Bureau, 2019 Annual Capital Expenditures Survey Note: Detail may not add to total because of rounding. NS: Not Statistically Significant See Technical Documentation Methodology Data Quality for information on sampling variability, confidence intervals and statistical significance. |
|||||
Administrative and support and waste management
Capital Expenditures for Structures and Equipment for Companies with Employees: 2019 and 2018 Revised (Billions of current dollars) |
|||||
|---|---|---|---|---|---|
Capital expenditures |
2019 |
2018 |
% Change |
||
Total Administrative and support and waste management |
31.7 |
29.4 |
7.7% |
NS |
|
Structures |
7.5 |
7.0 |
7.5% |
NS |
|
Equipment |
24.2 |
22.4 |
7.8% |
NS |
|
| Source: U.S. Census Bureau, 2019 Annual Capital Expenditures Survey Note: Detail may not add to total because of rounding. NS: Not Statistically Significant See Technical Documentation Methodology Data Quality for information on sampling variability, confidence intervals and statistical significance. |
|||||
Arts, Entertainment, and Recreation
Capital Expenditures for Structures and Equipment for Companies with Employees: 2019 and 2018 Revised (Billions of current dollars) |
|||||
|---|---|---|---|---|---|
Capital expenditures |
2019 |
2018 |
% Change |
||
Total Arts, Entertainment, and Recreation |
24.5 |
24.7 |
-0.8% |
NS |
|
Structures |
15.2 |
14.8 |
3.2% |
NS |
|
Equipment |
9.3 |
10.0 |
-6.6% |
NS |
|
| Source: U.S. Census Bureau, 2019 Annual Capital Expenditures Survey Note: Detail may not add to total because of rounding. NS: Not Statistically Significant See Technical Documentation Methodology Data Quality for information on sampling variability, confidence intervals and statistical significance. |
|||||
Other Services (except public administration)
Capital Expenditures for Structures and Equipment for Companies with Employees: 2019 and 2018 Revised (Billions of current dollars) |
|||||
|---|---|---|---|---|---|
Capital expenditures |
2019 |
2018 |
% Change |
||
Total Other Services (except public administration) |
25.3 |
22.2 |
14.0% |
NS |
|
Structures |
15.2 |
12.4 |
22.8% |
NS |
|
Equipment |
10.1 |
9.8 |
2.8% |
NS |
|
| Source: U.S. Census Bureau, 2019 Annual Capital Expenditures Survey Note: Detail may not add to total because of rounding. NS: Not Statistically Significant See Technical Documentation Methodology Data Quality for information on sampling variability, confidence intervals and statistical significance. |
|||||
Management of companies and enterprises
Capital Expenditures for Structures and Equipment for Companies with Employees: 2019 and 2018 Revised (Billions of current dollars) |
|||||
|---|---|---|---|---|---|
Capital expenditures |
2019 |
2018 |
% Change |
||
Total Management of companies and enterprises |
7.3 |
6.9 |
6.2% |
|
|
Structures |
1.7 |
1.7 |
-1.0% |
NS |
|
Equipment |
5.6 |
5.1 |
8.6% |
|
|
| Source: U.S. Census Bureau, 2019 Annual Capital Expenditures Survey Note: Detail may not add to total because of rounding. NS: Not Statistically Significant See Technical Documentation Methodology Data Quality for information on sampling variability, confidence intervals and statistical significance. |
|||||
Forestry, fishing, and agricultural services
Capital Expenditures for Structures and Equipment for Companies with Employees: 2019 and 2018 Revised (Billions of current dollars) |
|||||
|---|---|---|---|---|---|
Capital expenditures |
2019 |
2018 |
% Change |
||
Total Forestry, fishing, and agricultural services |
4.1 |
4.7 |
-12.8% |
NS |
|
Structures |
.8 |
.7 |
17.3% |
NS |
|
Equipment |
3.2 |
3.9 |
-18.3% |
NS |
|
| Source: U.S. Census Bureau, 2019 Annual Capital Expenditures Survey Note: Detail may not add to total because of rounding. NS: Not Statistically Significant See Technical Documentation Methodology Data Quality for information on sampling variability, confidence intervals and statistical significance. |
|||||

Related Information
Page Last Revised - October 8, 2021
✕
Is this page helpful?
 Yes
Yes
 No
No
 Yes
Yes
 No
No✕
NO THANKS
255 characters maximum
 255 characters maximum reached
✕
Thank you for your feedback.
Comments or suggestions?

Comments or suggestions?