Survey of Business Owners (SBO) - Asian-Owned Firms: 2007
Survey of Business Owners (SBO) - Asian-Owned Firms: 2007
Summary of Findings
Asians owned 1.5 million nonfarm U.S. businesses operating in the fifty states and the District of Columbia in 2007, an increase of 40.4 percent from 2002. These Asian-owned firms accounted for 5.7 percent of all nonfarm businesses in the United States, employed 2.8 million persons (2.4 percent of total employment) and generated $507.6 billion in receipts (1.7 percent of total receipts).
These findings come from the U.S. Census Bureau's 2007 Survey of Business Owners (SBO) and were collected as part of the 2007 Economic Census. The SBO includes a sample of more than 2.3 million nonfarm businesses filing 2007 tax forms as individual proprietorships, partnerships, or any type of corporation, and with receipts of $1,000 or more. The SBO defines Asian-owned businesses as firms in which persons of Asian origin own 51 percent or more of the equity, interest or stock of the business.
Based on standards developed by both the Executive and Legislative Branches of the Federal Government, Asian-owned businesses are also classified by detailed group:
- Asian Indian-owned. Fifty-one percent or more owned by persons of Asian Indian origin.
- Chinese-owned. Fifty-one percent or more owned by persons of Chinese origin.
- Filipino-owned. Fifty-one percent or more owned by persons of Filipino origin.
- Japanese-owned. Fifty-one percent or more owned by persons of Japanese origin.
- Korean-owned. Fifty-one percent or more owned by persons of Korean origin.
- Vietnamese-owned. Fifty-one percent or more owned by persons of Vietnamese origin.
- Other Asian-owned. Fifty-one percent or more owned by persons of Other Asian origin [for example, Hmong, Laotian, Thai, Pakistani, or Cambodian]
Among the detailed Asian groups, Asian Indians owned 308,514 firms (19.9 percent of all Asian-owned firms), with receipts of $152.5 billion (30.0 percent of all Asian-owned firm receipts). Chinese owned 423,609 firms (27.3 percent), with receipts of $142.8 billion (28.1 percent). Filipinos owned 163,217 firms (10.5 percent), with receipts of $20.2 billion (4.0 percent). Japanese owned 108,361 firms (7.0 percent), with receipts of $39.6 billion (7.8 percent). Koreans owned 192,465 firms (12.4 percent), with receipts of $78.6 billion (15.5 percent). Vietnamese owned 229,149 firms (14.8 percent), with receipts of $28.8 billion (5.7 percent). Other Asians owned 153,565 firms (9.9 percent), with receipts of $45.1 billion (8.9 percent). Chart 25 and Chart 26 show by detailed group the number of Asian-owned firms and the receipts of these firms respectively.
Table 7 shows the changes in the number of firms and sales and receipts for all U.S. businesses from 2002 to 2007 by detailed Asian group.
Kind-of-Business Characteristics
In 2007, 44.7 percent of Asian-owned U.S. firms operated in the repair, maintenance, personal, and laundry services (NAICS 81) sector; the professional, scientific, and technical services (NAICS 54) sector; and the retail trade (NAICS 44-45) sector. Asian-owned firms accounted for 7.2 percent of all U.S. businesses in these industries. Wholesale trade (NAICS 42) and retail trade (NAICS 44-45) accounted for 46.9 percent of Asian-owned business revenue. Table 5 and Chart 1 show the distribution of Asian-owned firms by sector.
Among Asian Indian-owned U.S. firms, 48.9 percent were in the professional, scientific, and technical services (NAICS 54) sector; the retail trade (NAICS 44-45) sector; and the health care and social assistance (NAICS 62) sector. Asian Indian-owned U.S. firms accounted for 1.7 percent of all U.S. businesses in these sectors. Chart 2 shows the distribution of Asian Indian-owned U.S. firms by sector. Retail trade (NAICS 44-45), wholesale trade (NAICS 42), and professional, scientific, and technical services (NAICS 54) accounted for 59.1 percent of Asian Indian-owned business revenue.
Among Chinese-owned U.S. firms, 40.0 percent were in the professional, scientific, and technical services (NAICS 54) sector; the accommodation and food services (NAICS 72) sector; and the repair, maintenance, personal, and laundry services (NAICS 81) sector. Chinese-owned U.S. firms accounted for 2.2 percent of all U.S. businesses in these sectors. Chart 3 shows the distribution of Chinese-owned U.S. firms by sector. Wholesale trade (NAICS 42) and accommodation and food services (NAICS 72) accounted for 50.4 percent of Chinese-owned business revenue.
Among Filipino-owned U.S. firms, 49.0 percent were in the health care and social assistance (NAICS 62) sector; the professional, scientific, and technical services (NAICS 54) sector; and the repair, maintenance, personal, and laundry services (NAICS 81) sector. Filipino-owned U.S. firms accounted for 0.9 percent of all U.S. businesses in these sectors. Chart 4 shows the distribution of Filipino-owned U.S. firms by sector. Health care and social assistance (NAICS 62) accounted for 33.4 percent of Filipino-owned business revenue.
Among Japanese-owned U.S. firms, 32.2 percent were in the professional, scientific, and technical services (NAICS 54) and the repair, maintenance, personal, and laundry services (NAICS 81) sectors. Japanese-owned U.S. firms accounted for 0.5 percent of all U.S. businesses in these sectors. Chart 5 shows the distribution of Japanese-owned U.S. firms by sector. Wholesale trade (NAICS 42) accounted for 29.2 percent of Japanese-owned business revenue.
Among Korean-owned U.S. firms, 40.4 were in the repair, maintenance, personal, and laundry services (NAICS 81) and the retail trade (NAICS 44-45) sectors. Korean-owned U.S. firms accounted for 1.3 percent of all U.S. businesses in these sectors. Chart 6 shows the distribution of Korean-owned U.S. firms by sector. Wholesale trade (NAICS 42) and retail trade (NAICS 44-45) accounted for 53.6 percent of Korean-owned business revenue.
Among Vietnamese-owned U.S. firms, 66.9 percent were in the repair, maintenance, personal, and laundry services (NAICS 81) and the retail trade (NAICS 44-45) sectors. Vietnamese-owned U.S. firms accounted for 2.6 percent of all U.S. businesses in these sectors. Chart 7 shows the distribution of Vietnamese-owned U.S. firms by sector.
Among Other Asian-owned U.S. firms, 16.0 percent were in the retail trade (NAICS 44-45) sector. Other Asian-owned U.S. firms accounted for 0.9 percent of all U.S. businesses in this sector. Chart 8 shows the distribution of Other Asian-owned U.S. firms by sector. Retail trade (NAICS 44-45) and wholesale trade (NAICS 42) accounted for 55.9 percent of Other Asian-owned business revenue.
Geographic Characteristics
Asian-Owned Businesses
California had the largest number of Asian-owned firms at 509,097 (32.9 percent of all Asian-owned firms), with receipts of $181.9 billion (35.8 percent of all Asian-owned firm receipts). New York and Texas were next with 196,852 (12.7 percent) and 114,336 (7.4 percent) Asian-owned firms respectively, with receipts of $50.6 billion (10.0 percent) and $40.2 billion (7.9 percent) respectively. Table 1 and Map 1 show, for each state, the number of Asian-owned firms as a percentage of the total number of firms in that state in 2007. Table 6 and Map 2 show, for each state, the change in the number of Asian-owned firms from 2002 to 2007.
Among U.S. counties, Los Angeles County, California, had the largest number of Asian-owned firms in 2007 at 183,092. Queens County, New York, was second with 68,606 while Orange County, California, was third with 63,416. Table 2 shows, for the 50 most populous counties, the number of Asian-owned firms as a percentage of the total number of firms in each respective county in 2007.
The metropolitan statistical areas with the largest number of Asian-owned firms were Los Angeles-Long Beach-Santa Ana, CA (246,429); New York-Northern New Jersey-Long Island, NY-NJ-PA (240,371); and San Francisco-Oakland-Fremont, CA (89,508). Table 4 shows, for the 50 most populous metropolitan statistical areas, the number of Asian-owned firms as a percentage of the total number of firms in each respective city in 2007.
Statistics for Asian-owned firms in the 50 most populous cities in 2007 can be found in Table 3.
Asian Indian-Owned Businesses
California had the largest number of Asian Indian-owned firms at 58,995 (19.1 percent of all Asian Indian-owned firms), with receipts of $29.1 billion (19.1 percent of all Asian Indian-owned firm receipts). New York and Texas were next with 47,760 (15.5 percent) and 27,748 (9.0 percent) Asian Indian-owned firms respectively, with receipts of $17.2 billion (11.3 percent) and $14.0 billion (9.2 percent) respectively.
Among U.S. counties, Los Angeles County, California, and Queens County, New York, had the largest numbers of Asian Indian-owned firms in 2007 at 16,730 and 16,324 respectively.
The metropolitan statistical areas with the largest number of Asian Indian-owned firms were New York-Northern New Jersey-Long Island, NY-NJ-PA (64,457); Los Angeles-Long Beach-Santa Ana, CA (23,151); and Chicago-Naperville-Joliet, IL-IN-WI (17,362).
Chinese-Owned Businesses
California had the largest number of Chinese-owned firms at 166,411 (39.3 percent of all Chinese-owned firms), with receipts of $69.5 billion (48.7 percent of all Chinese-owned firm receipts). New York and Texas were next with 86,025 (20.3 percent) and 19,864 (4.7 percent) Chinese-owned firms respectively, with receipts of $19.2 billion (13.5 percent) and $7.1 billion (5.0 percent) respectively.
Among U.S. counties, Los Angeles County, California, had the largest number of Chinese-owned firms in 2007 at 61,758. Queens County, New York, was second with 31,379 Chinese-owned firms.
The metropolitan statistical areas with the largest number of Chinese-owned firms were New York-Northern New Jersey-Long Island, NY-NJ-PA (94,314); Los Angeles-Long Beach-Santa Ana, CA (77,651); and San Francisco-Oakland-Fremont, CA (38,871).
Filipino-Owned Businesses
California had the largest number of Filipino-owned firms at 81,348 (49.8 percent of all Filipino-owned firms), with receipts of $9.1 billion (45.0 percent of all Filipino-owned firm receipts).
Among U.S. counties, Los Angeles County, California, had the largest number of Filipino-owned firms in 2007 at 28,660. Orange County, California, was second with 8,918 Filipino-owned firms.
The metropolitan statistical area with the largest number of Filipino-owned firms was Los Angeles-Long Beach-Santa Ana, CA (37,535).
Japanese-Owned Businesses
California had the largest number of Japanese-owned firms at 41,727 (38.5 percent of all Japanese-owned firms), with receipts of $16.5 billion (41.7 percent of all Japanese-owned firm receipts). Hawaii and New York were next with 26,707 (24.6 percent) and 6,851 (6.3 percent) Japanese-owned firms respectively, with receipts of $11.0 billion (27.7 percent) and $1.0 billion (2.6 percent) respectively.
Among U.S. counties, Honolulu County, Hawaii, had the largest number of Japanese-owned firms in 2007 at 19,241. Los Angeles County, California, was second with 16,391, while Orange County, California, was third with 4,666 Japanese-owned firms.
The metropolitan statistical areas with the largest number of Japanese-owned firms were Los Angeles-Long Beach-Santa Ana, CA (21,051) and Honolulu, HI (19,241).
Korean-Owned Businesses
California had the largest number of Korean-owned firms at 63,365 (32.9 percent of all Korean-owned firms), with receipts of $32.8 billion (41.7 percent of all Korean-owned firm receipts). New York and New Jersey were next with 23,948 (12.4 percent) and 13,610 (7.1 percent) Korean-owned firms respectively, with receipts of $7.7 billion (9.8 percent) and $5.6 billion (7.1 percent) respectively.
Among U.S. counties, Los Angeles, California, had the largest number of Korean-owned firms in 2007 at 31,086. Orange County, California, was second with 8,905, while Queens County, New York, was third with 7,619 Korean-owned firms.
The metropolitan statistical areas with the largest number of Korean-owned firms were Los Angeles-Long Beach-Santa Ana, CA (39,982); New York-Northern New Jersey-Long Island, NY-NJ-PA (34,189); and Washington-Arlington-Alexandria, DC-VA-MD-WV (11,424).
Vietnamese-Owned Businesses
California had the largest number of Vietnamese-owned firms at 68,812 (30.0 percent of all Vietnamese-owned firms), with receipts of $13.4 billion (46.5 percent of all Vietnamese-owned firm receipts). Texas and Florida were next with 36,171 (15.8 percent) and 14,780 (6.4 percent) Vietnamese-owned firms respectively, with receipts of $3.7 billion (12.7 percent) and $1.0 billion (3.4 percent) respectively.
Among U.S. counties, Los Angeles, California, had the largest number of Vietnamese-owned firms in 2007 at 17,695.
The metropolitan statistical areas with the largest number of Vietnamese-owned firms were Los Angeles-Long Beach-Santa Ana, CA (32,356); Houston-Sugar Land-Baytown, TX (16,982); and Dallas-Fort Worth-Arlington, TX (12,038).
Other Asian-Owned Businesses
California had the largest number of Other Asian-owned firms at 35,879 (23.4 percent of all Other Asian-owned firms), with receipts of $12.3 billion (27.3 percent of all Other Asian-owned firm receipts). New York and Texas were next with 23,126 (15.1 percent) and 14,594 (9.5 percent) Other Asian-owned firms respectively, with receipts of $3.0 billion (6.8 percent) and $7.3 billion (16.1 percent) respectively.
Among U.S. counties, Los Angeles, California, had the largest number of Other Asian-owned firms in 2007 at 13,446. Queens County, New York, was second with 8,868 Other Asian-owned firms.
The metropolitan statistical areas with the largest number of Other Asian-owned firms were New York-Northern New Jersey-Long Island, NY-NJ-PA (25,824); Los Angeles-Long Beach-Santa Ana, CA (17,689); and Washington-Arlington-Alexandria, DC-VA-MD-WV (8,370).
Employer Firm Characteristics
The SBO collects data from both employer and nonemployer businesses. Employer businesses are firms with paid employees, including workers on the payroll and excluding sole proprietors and partners. Nonemployer businesses are firms without paid employees, including sole proprietors and partners of unincorporated businesses that do not have any other employees on the payroll. Employer and nonemployer statistics for Asian-owned firms can be found in Table 7.
In 2007, there were 397,484 Asian-owned employer firms, an increase of 24.4 percent from 2002. These firms employed 2.8 million persons, an increase of 27.5 percent from 2002, and had a total payroll of $79.6 billion, an increase of 42.1 percent from 2002. In 2007, these firms generated $455.2 billion in receipts, an increase of 56.3 percent from 2002. In 2007, employer firms accounted for 25.6 percent of the total number of Asian-owned firms and 89.7 percent of Asian-owned firms’ receipts. Average receipts for these Asian-owned employer firms in 2007 were $1.1 million.
In 2007, there were 109,196 Asian Indian-owned employer firms, an increase of 32.5 percent from 2002. These firms employed 850,191 persons, an increase of 39.4 percent from 2002, and had a total payroll of $26.8 billion, an increase of 52.4 percent from 2002. In 2007, these firms generated $140.9 billion in receipts, an increase of 75.9 percent from 2002. In 2007, employer firms accounted for 35.4 percent of the total number of Asian Indian-owned firms and 92.4 percent of Asian Indian-owned firms’ receipts. Average receipts for these Asian Indian-owned employer firms in 2007 were $1.3 million.
In 2007, there were 109,614 Chinese-owned employer firms, an increase of 23.1 percent from 2002. These firms employed 782,738 persons, an increase of 20.6 percent from 2002, and had a total payroll of $20.8 billion, an increase of 36.1 percent from 2002. In 2007, these firms generated $128.0 billion in receipts, an increase of 33.7 percent from 2002. In 2007, employer firms accounted for 25.9 percent of the total number of Chinese-owned firms and 89.7 percent of Chinese-owned firms’ receipts. Average receipts for these Chinese-owned employer firms in 2007 were $1.2 million.
In 2007, there were 21,071 Filipino-owned employer firms. These firms employed 142,150 persons and had a total payroll of $4.5 billion. In 2007, these firms generated $15.8 billion in receipts, an increase of 43.8 percent from 2002. In 2007, employer firms accounted for 12.9 percent of the total number of Filipino-owned firms and 77.9 percent of Filipino-owned firms’ receipts. Average receipts for these Filipino-owned employer firms in 2007 were $747,602.
In 2007, there were 22,823 Japanese-owned employer firms. These firms employed 210,226 persons and had a total payroll of $7.2 billion, an increase of 24.9 percent from 2002. In 2007, these firms generated $36.1 billion in receipts, an increase of 29.7 percent from 2002. In 2007, employer firms accounted for 21.1 percent of the total number of Japanese-owned firms and 91.3 percent of Japanese-owned firms’ receipts. Average receipts for these Japanese-owned employer firms in 2007 were $1.6 million.
In 2007, there were 71,423 Korean-owned employer firms, an increase of 25.1 percent from 2002. These firms employed 428,354 persons, an increase of 33.6 percent from 2002, and had a total payroll of $10.1 billion, an increase of 50.7 percent from 2002. In 2007, these firms generated $72.2 billion in receipts, an increase of 75.0 percent from 2002. In 2007, employer firms accounted for 37.1 percent of the total number of Korean-owned firms and 91.9 percent of Korean-owned firms’ receipts. Average receipts for these Korean-owned employer firms in 2007 were $1.0 million.
In 2007, there were 29,782 Vietnamese-owned employer firms, an increase of 16.4 percent from 2002. These firms employed 166,425 persons and had a total payroll of $3.8 billion. In 2007, these firms generated $21.0 billion in receipts, an increase of 82.1 percent from 2002. In 2007, employer firms accounted for 13.0 percent of the total number of Vietnamese-owned firms and 72.9 percent of Vietnamese-owned firms’ receipts. Average receipts for these Korean-owned employer firms in 2007 were $705,157.
In 2007, there were 37,367 Other Asian-owned employer firms, an increase of 50.5 percent from 2002. These firms employed 257,036 persons, an increase of 59.9 percent from 2002, and had a total payroll of $6.2 billion, an increase of 62.6 percent from 2002. In 2007, these firms generated $40.4 billion in receipts, an increase of 85.8 percent from 2002. In 2007, employer firms accounted for 24.3 percent of the total number of Other Asian-owned firms and 89.4 percent of Other Asian-owned firms’ receipts. Average receipts for these Other Asian-owned employer firms in 2007 were $1.1 million.
Nonemployer Firm Characteristics
In 2007, 1.2 million Asian-owned firms had no paid employees, an increase of 46.9 percent from 2002. These nonemployer firms generated $52.5 billion in receipts, an increase of 47.8 percent from 2002. In 2007, nonemployers accounted for 74.4 percent of the total number of Asian-owned firms and 10.3 percent of receipts. Average receipts for these Asian-owned nonemployer firms in 2007 were $45,543.
In 2007, 199,318 Asian Indian-owned firms had no paid employees, an increase of 41.6 percent from 2002. These nonemployer firms generated $11.5 billion in receipts, an increase of 44.4 percent from 2002. In 2007, nonemployers accounted for 64.6 percent of the total number of Asian Indian-owned firms and 7.6 percent of receipts. Average receipts for these Asian Indian-owned nonemployer firms in 2007 were $57,928.
In 2007, 313,995 Chinese-owned firms had no paid employees, an increase of 59.4 percent from 2002. These nonemployer firms generated $14.7 billion in receipts, an increase of 58.0 percent from 2002. In 2007, nonemployers accounted for 74.1 percent of the total number of Chinese-owned firms and 10.3 percent of receipts. Average receipts for these Chinese-owned nonemployer firms in 2007 were $46,905.
In 2007, 142,146 Filipino-owned firms had no paid employees, an increase of 35.0 percent from 2002. These nonemployer firms generated $4.5 billion in receipts, an increase of 39.4 percent from 2002. In 2007, nonemployers accounted for 87.1 percent of the total number of Filipino-owned firms and 22.1 percent of receipts. Average receipts for these Filipino-owned nonemployer firms in 2007 were $31,408.
In 2007, 85,537 Japanese-owned firms had no paid employees, an increase of 32.1 percent from 2002. These nonemployer firms generated $3.4 billion in receipts, an increase of 24.4 percent from 2002. In 2007, nonemployers accounted for 78.9 percent of the total number of Japanese-owned firms and 8.7 percent of receipts. Average receipts for these Japanese-owned nonemployer firms in 2007 were $40,254.
In 2007, 121,041 Korean-owned firms had no paid employees, an increase of 20.3 percent from 2002. These nonemployer firms generated $6.4 billion in receipts. In 2007, nonemployers accounted for 62.9 percent of the total number of Korean-owned firms and 8.1 percent of receipts. Average receipts for these Korean-owned nonemployer firms in 2007 were $52,748.
In 2007, 199,367 Vietnamese-owned firms had no paid employees, an increase of 64.2 percent from 2002. These nonemployer firms generated $7.8 billion in receipts, an increase of 96.0 percent from 2002. In 2007, nonemployers accounted for 87.0 percent of the total number of Vietnamese-owned firms and 27.1 percent of receipts. Average receipts for these Vietnamese-owned nonemployer firms in 2007 were $39,123.
In 2007, 116,198 Other Asian-owned firms had no paid employees, an increase of 80.8 percent from 2002. These nonemployer firms generated $4.8 billion in receipts, an increase of 87.2 percent from 2002. In 2007, nonemployers accounted for 75.7 percent of the total number of Other Asian-owned firms and 10.6 percent of receipts. Average receipts for these Other Asian-owned nonemployer firms in 2007 were $41,013.
Size of Firm Characteristics
The SBO tabulates data by receipts and employment size of firm. Employment size of firm data include firms with payroll at any time during 2007. Employment reflects the number of paid employees during the March 12 pay period.
Asian-Owned Businesses
In 2007, 251,703 Asian-owned firms had receipts of less than $5,000 (16.2 percent of the total number of Asian-owned firms), while 78,144 Asian-owned firms had receipts of $1,000,000 or more (5.0 percent of all Asian-owned firms). Chart 9 shows the distribution of Asian-owned businesses by receipts size of firm.
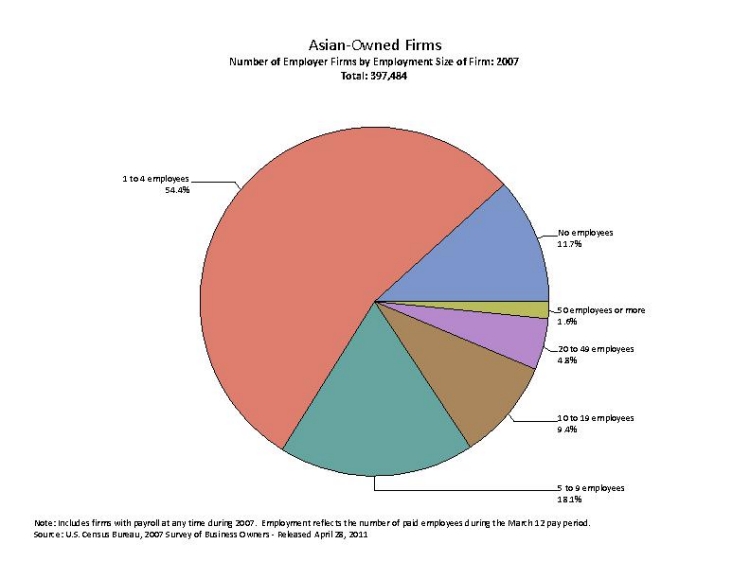
There were 262,954 Asian-owned employer firms with less than five employees (66.2 percent of the total number of Asian-owned employer firms) that generated $106.4 billion in receipts (23.4 percent of all Asian-owned employer firm receipts). In comparison, 6,193 Asian-owned employer firms had 50 or more employees (1.6 percent) and generated $131.2 billion in receipts (28.8 percent). Chart 17 shows the distribution of Asian-owned businesses with paid employees by employment size of firm.
Asian Indian-Owned Businesses
In 2007, 41,047 Asian Indian-owned firms had receipts of less than $5,000 (13.3 percent of the total number of Asian Indian-owned firms), while 28,083 Asian Indian-owned firms had receipts of $1,000,000 or more (9.1 percent of all Asian Indian-owned firms). Chart 10 shows the distribution of Asian Indian-owned businesses by receipts size of firm.
There were 69,935 Asian Indian-owned employer firms with less than five employees (64.0 percent of the total number of Asian Indian-owned employer firms) that generated $38.6 billion in receipts (27.4 percent of all Asian-owned employer firm receipts). In comparison, 1,959 Asian Indian-owned employer firms had 50 or more employees (1.8 percent) and generated $36.6 billion in receipts (26.0 percent). Chart 18 shows the distribution of Asian Indian-owned businesses with paid employees by employment size of firm.
Chinese-Owned Businesses
In 2007, 74,587 Chinese-owned firms had receipts of less than $5,000 (17.6 percent of the total number of Chinese-owned firms), while 19,410 Chinese-owned firms had receipts of $1,000,000 or more (4.6 percent of all Chinese-owned firms). Chart 11 shows the distribution of Chinese-owned businesses by receipts size of firm.
There were 71,719 Chinese-owned employer firms with less than five employees (65.4 percent of the total number of Chinese-owned employer firms) that generated $25.4 billion in receipts (19.9 percent of all Chinese-owned employer firm receipts). In comparison, 1,660 Chinese-owned employer firms had 50 or more employees (1.5 percent) and generated $39.6 billion in receipts (30.9 percent). Chart 19 shows the distribution of Chinese-owned businesses with paid employees by employment size of firm.
Filipino-Owned Businesses
In 2007, 38,534 Filipino-owned firms had receipts of less than $5,000 (23.6 percent of the total number of Filipino-owned firms), while 2,990 Filipino-owned firms had receipts of $1,000,000 or more (1.8 percent of all Filipino-owned firms). Chart 12 shows the distribution of Filipino-owned businesses by receipts size of firm.
There were 14,155 Filipino-owned employer firms with less than five employees (67.2 percent of the total number of Filipino-owned employer firms) that generated $3.6 billion in receipts (22.7 percent of all Filipino-owned employer firm receipts). In comparison, 404 Filipino-owned employer firms had 50 or more employees (1.9 percent) and generated $4.5 billion in receipts (28.4 percent). Chart 20 shows the distribution of Filipino-owned businesses with paid employees by employment size of firm.
Japanese-Owned Businesses
In 2007, 22,047 Japanese-owned firms had receipts of less than $5,000 (20.3 percent of the total number of Japanese-owned firms), while 5,220 Japanese-owned firms had receipts of $1,000,000 or more (4.8 percent of all Japanese-owned firms). Chart 13 shows the distribution of Japanese-owned businesses by receipts size of firm.
There were 13,535 Japanese-owned employer firms with less than five employees (59.3 percent of the total number of Japanese-owned employer firms) that generated $4.5 billion in receipts (12.5 percent of all Japanese-owned employer firm receipts). In comparison, 653 Japanese-owned employer firms had 50 or more employees (2.9 percent) and generated $14.5 billion in receipts (40.2 percent). Chart 21 shows the distribution of Japanese-owned businesses with paid employees by employment size of firm.
Korean-Owned Businesses
In 2007, 22,795 Korean-owned firms had receipts of less than $5,000 (11.8 percent of the total number of Korean-owned firms), while 11,014 Korean-owned firms had receipts of $1,000,000 or more (5.7 percent of all Korean-owned firms). Chart 14 shows the distribution of Korean-owned businesses by receipts size of firm.
There were 50,599 Korean-owned employer firms with less than five employees (70.8 percent of the total number of Korean-owned employer firms) that generated $18.3 billion in receipts (25.3 percent of all Korean-owned employer firm receipts). In comparison, 744 Korean-owned employer firms had 50 or more employees (1.0 percent) and generated $18.8 billion in receipts (26.0 percent). Chart 22 shows the distribution of Korean-owned businesses with paid employees by employment size of firm.
Vietnamese-Owned Businesses
In 2007, 34,383 Vietnamese-owned firms had receipts of less than $5,000 (15.0 percent of the total number of Vietnamese-owned firms), while 3,738 Vietnamese-owned firms had receipts of $1,000,000 or more (1.6 percent of all Vietnamese firms). Chart 15 shows the distribution of Vietnamese-owned businesses by receipts size of firm.
There were 21,372 Vietnamese-owned employer firms with less than five employees (71.8 percent of the total number of Vietnamese-owned employer firms) that generated $6.0 billion in receipts (28.5 percent of all Vietnamese-owned employer firm receipts). In comparison, 304 Vietnamese-owned employer firms had 50 or more employees (1.0 percent) and generated $5.1 billion in receipts (24.3 percent). Chart 23 shows the distribution of Vietnamese-owned businesses with paid employees by employment size of firm.
Other Asian-Owned Businesses
In 2007, 23,688 Other Asian-owned firms had receipts of less than $5,000 (15.4 percent of the total number of Other Asian-owned firms), while 7,861 Other Asian-owned firms had receipts of $1,000,000 or more (5.1 percent of all Other Asian-owned firms). Chart 16 shows the distribution of Other Asian-owned businesses by receipts size of firm.
There were 24,584 Other Asian-owned employer firms with less than five employees (65.8 percent of the total number of Other Asian-owned employer firms) that generated $11.1 billion in receipts (27.6 percent of all Other Asian-owned employer firm receipts). In comparison, 494 Other Asian-owned employer firms had 50 or more employees (1.3 percent) and generated $9.7 billion in receipts (24.0 percent). Chart 24 shows the distribution of Other Asian-owned businesses with paid employees by employment size of firm.
Data Comparability to Prior Surveys
The 2007 and 2002 SBO data were published according to the 2007 and 2002 North American Industry Classification System (NAICS) respectively. Prior to the 2002 SBO, data were published according to the Standard Industrial Classification (SIC) system. Additional changes affecting data comparability are discussed in detail in Methodology, in the section titled "Comparability of the 2007 and 2002 SBO Data."
Tables


Visualizations
-
VisualizationSBO - Asian Chinese-Owned Firms: 2007 VisualizationsApril 28, 2011The Asian Chinese-Owned Firms graphs in this report are from the 2007 Survey of Business Owners.
-
VisualizationSBO - Asian Filipino-Owned Firms: 2007 VisualizationsApril 28, 2011The Asian Filipino-Owned Firms graphs in this report are from the 2007 Survey of Business Owners.
-
VisualizationSBO - Asian Indian-Owned Firms: 2007 VisualizationsApril 28, 2011The Asian Indian-Owned Firms graphs in this report are from the 2007 Survey of Business Owners.
-
VisualizationSBO - Asian Japanese-Owned Firms: 2007 VisualizationsApril 28, 2011The Asian Japanese-Owned Firms graphs in this report are from the 2007 Survey of Business Owners.
-
VisualizationSBO - Asian Korean-Owned Firms: 2007 VisualizationsApril 28, 2011The Asian Korean-Owned Firms graphs in this report are from the 2007 Survey of Business Owners.
-
VisualizationSBO - Asian Others-Owned Firms: 2007 VisualizationsApril 28, 2011The Asian Others-Owned Firms graphs in this report are from the 2007 Survey of Business Owners.
-
VisualizationSBO - Asian Vietnamese-Owned Firms: 2007 VisualizationsApril 28, 2011The Asian Vietnamese-Owned Firms graphs in this report are from the 2007 Survey of Business Owners.
-
VisualizationSBO - Asian-Owned Firms: 2007 VisualizationsApril 28, 2011The Asian-Owned Firms graphs in this report are from the 2007 Survey of Business Owners.
Related Information