Two Rounds of Stimulus Payments Lifted 11.7 Million People Out of Poverty During the Pandemic in 2020
The more than $400 billion in two rounds of stimulus payments the government distributed during the pandemic helped lift 11.7 million people out of poverty in 2020, according to the Supplemental Poverty Measure (SPM) released today.
The U.S. Census Bureau publishes SPM, an alternative to the official poverty measure that incorporates the value of noncash government transfers, taxes and necessary expenses into the resources a family has available to meet its basic needs.
Today’s report shows that without stimulus payments, the supplemental poverty rate would have increased by approximately 3.6 percentage points.
The 2020 SPM Report shows how each element — including stimulus payments — impacted the number of people in poverty.
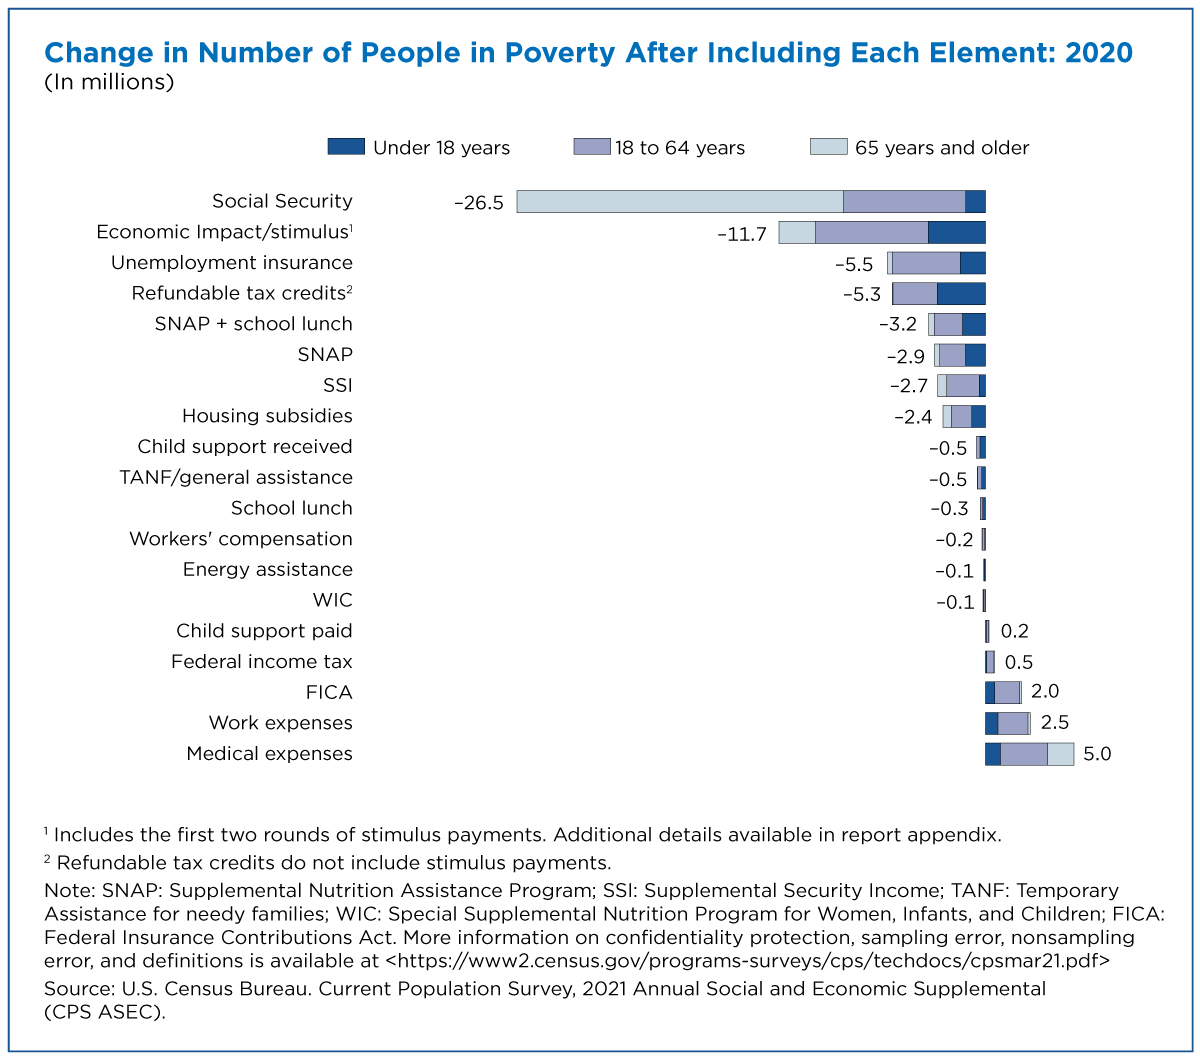
Stimulus payments were included as resources by the SPM in 2020. Today’s report shows that without stimulus payments, the supplemental poverty rate would have increased by approximately 3.6 percentage points.
In other words, approximately 11.7 million more people would have been considered in poverty if Congress had not authorized the payments and everything remained constant.
Stimulus Lifted Many Out of Poverty But Not All
Stimulus payments provided benefits to millions of people both above and below the SPM poverty threshold (not just those slightly below 100% of their poverty threshold). This widespread impact can be observed by examining income-to-poverty ratios.
An income-to-poverty ratio represents how much income (both cash and noncash) an individual or family receives in relation to its poverty threshold.
An individual whose income is equal to their poverty threshold has an income-to-poverty ratio of 1.00 (100%). Ratios below 1.00 indicate income below poverty and a ratio of greater than 1.00 indicates income above the poverty level.
For example, a ratio of 0.50 means that income was 50% of the poverty threshold.
The figure below shows the distribution of income-to-poverty ratio categories estimated without stimulus payments (pre-stimulus) and with stimulus payments in the definition of income (post-stimulus).
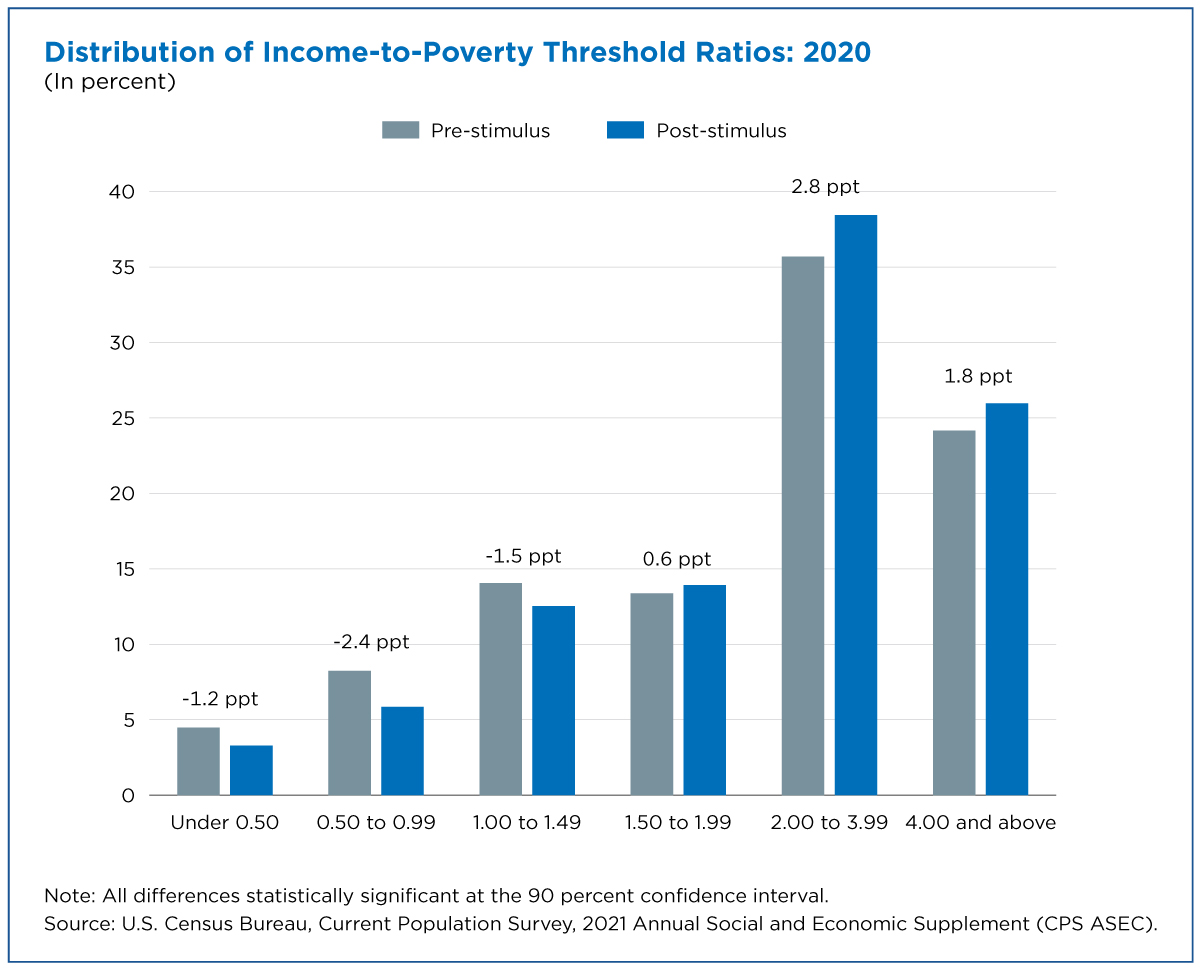
Stimulus payments significantly reduced the proportion of people in the lowest income-to-poverty ratio category (those with income less than 50% of the poverty threshold) by 1.2 percentage points to 3.3%.
It also reduced the proportion of individuals with resources between 50% to 99% of the poverty threshold by 2.4 percentage points, from 8.2% to 5.9% (differences due to rounding).
When including stimulus payments, the distribution of income-to-poverty ratios shifts to the right and more individuals fall into higher income-to-poverty ratio categories.
For instance, including stimulus in an individual’s resources increases the share of people in the second highest income-to-poverty ratio category (200 to 399% of the poverty threshold) by 2.8 percentage points to 38.4%.
Who Was Helped by Stimulus Payments?
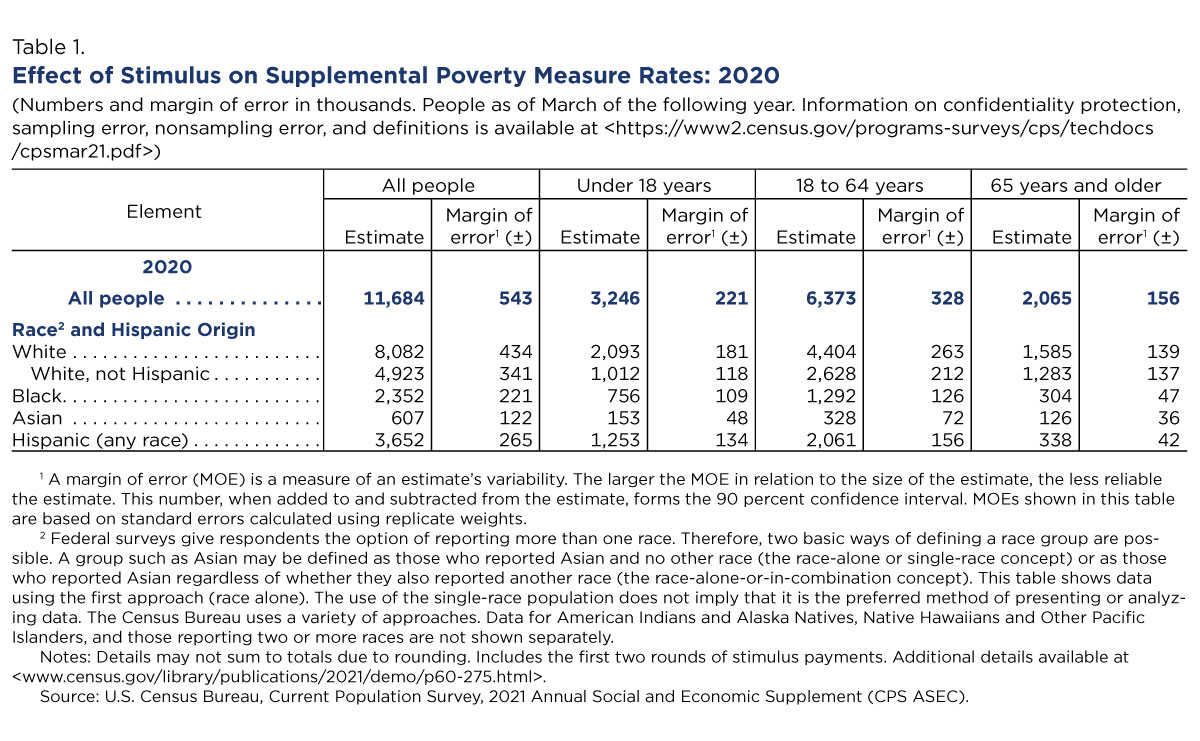
The 11.7 million people lifted out of poverty by stimulus payments includes (as shown in the figures and Table 1 below):
- 3.2 million children under 18.
- 6.4 million adults between 18 and 64.
- 2.1 million people over 65.
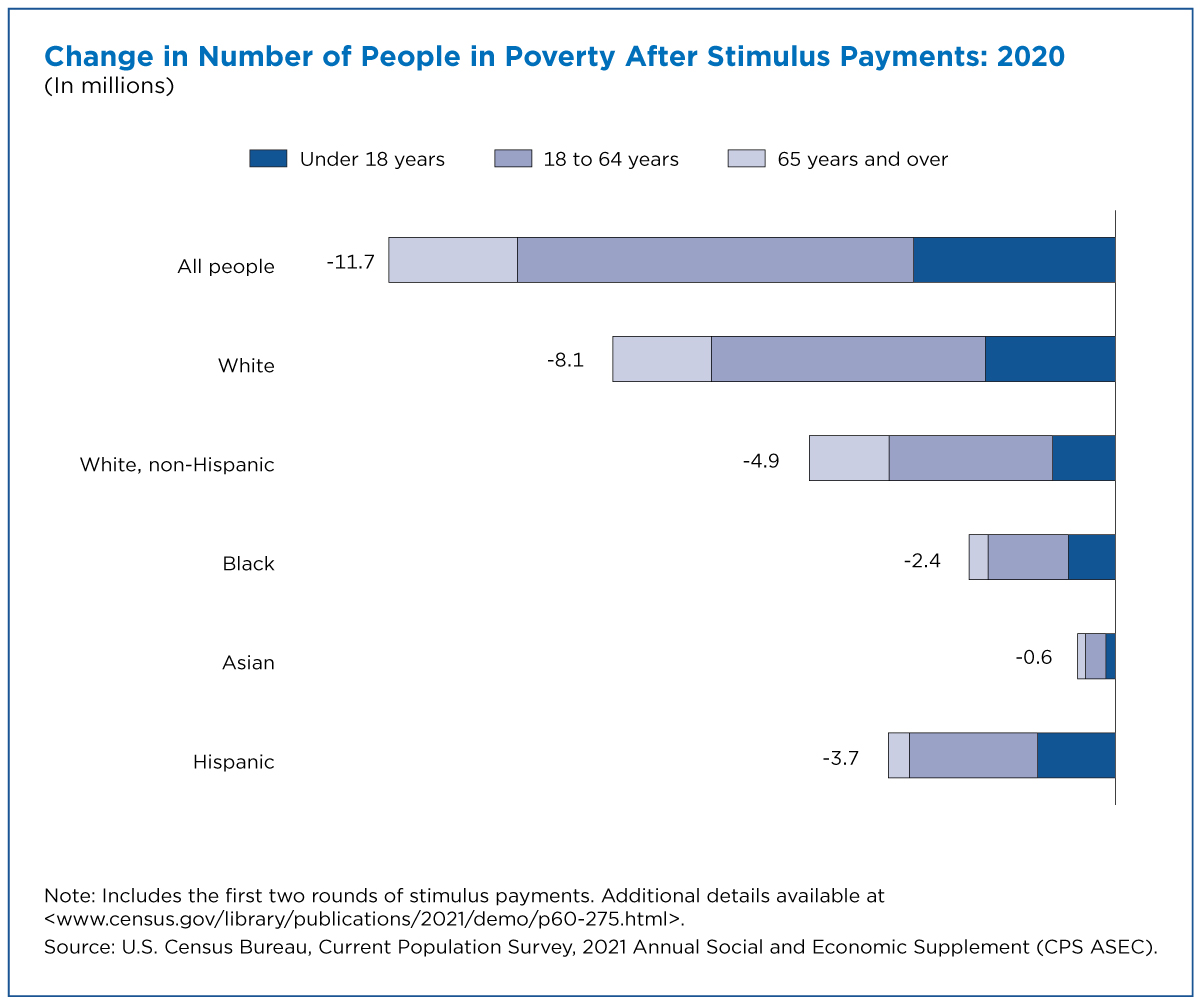
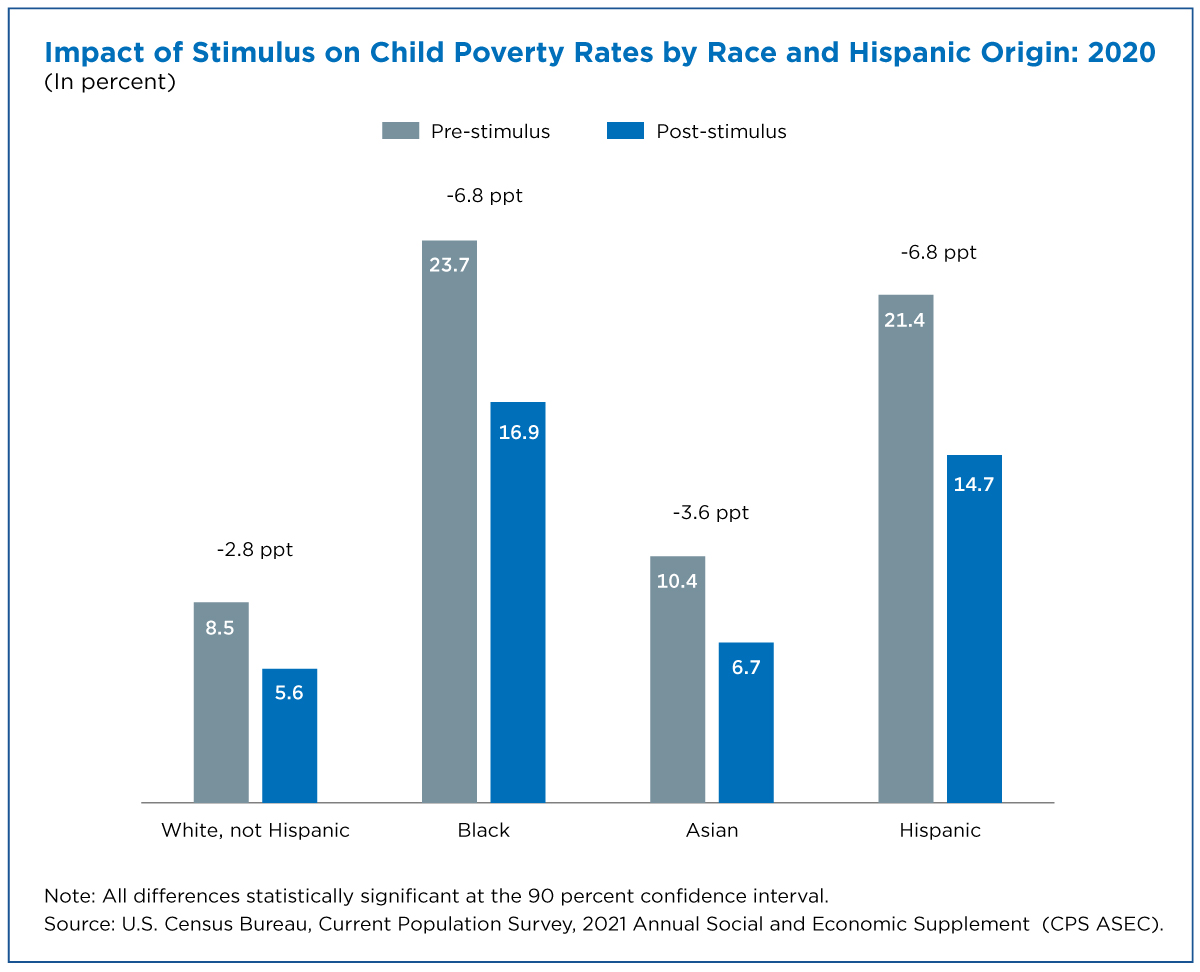
Stimulus payments significantly decreased the number of children experiencing poverty across several race and Hispanic origin groups (Figure 4).
Stimulus payments reduced the Black child poverty rate by 6.8 percentage points, from 23.7% to 16.9%. Overall, this amounts to 756,000 Black children lifted out of poverty by stimulus payments.
Similarly, stimulus payments reduced the Hispanic child poverty rate by 6.8 percentage points, representing 1.3 million Hispanic children. Additionally, 1 million White, non-Hispanic children and 153,000 Asian children were lifted out of poverty by stimulus payments.
The largest group of individuals lifted out of poverty were those between 18 and 64 years old (6.4 million). This includes 2.6 million White, non-Hispanic individuals and 1.3 million Black individuals.
More details on the impacts of policies and programs on the SPM rate are available in today’s SPM Report. Details about the methodology behind the calculation of the stimulus payments are available in this working paper. Finally, more information on confidentiality protection, methodology, sampling and nonsampling error, and definitions is available.
Kalee Burns is an economist and Danielle Wilson is an intern in the Census Bureau’s Poverty Statistics Branch. Liana E. Fox is the branch chief.
Income, Poverty and Health Insurance in the U.S.
Subscribe
Our email newsletter is sent out on the day we publish a story. Get an alert directly in your inbox to read, share and blog about our newest stories.
Contact our Public Information Office for media inquiries or interviews.
-
America Counts StoryDid Unemployment Insurance Lower Official Poverty Rates in 2020?September 14, 2021Expanded unemployment insurance benefits and eligibility during the pandemic lowered the overall poverty rate by 1.4 percentage points to 11.4% in 2020.
-
America Counts StoryPandemic Earnings Decline but Increase for Full-Time, Yearly WorkersSeptember 14, 2021How could earnings for full-time, year-round workers go up while earnings fell for all workers? There were fewer low-wage full-time, year-round workers.
-
America Counts StoryUninsured Rates for Children in Poverty Increased 2018–2020September 14, 2021Changes in children’s health coverage varied by poverty status from 2018 to 2020.
-
America Counts StoryPrivate Health Coverage of Adults Drops From Early 2019 to Early 2021September 14, 2021In early 2020, a decline in the number of working-age adults with private health insurance was offset by an increase in public health insurance programs.
-
America Counts StoryUnderstanding Equity Through Census Bureau DataSeptember 14, 2021U.S. Census Bureau surveys and programs provide insight into social, economic and housing equity gaps in the United States.
-
Families and Living ArrangementsOver a Third of Partners in Opposite-Sex Couples Were the Same AgeApril 27, 2026A new interactive data visualization explores characteristics of opposite-sex married and unmarried couples who lived together in 2025.
-
PopulationEight of the Nation’s Top 15 Last Names Stayed the Same Since 1790April 14, 2026Newly released names data from the 2020 Census show which first and last names are the most popular across the nation.
-
AgeU.S. Population Aging as Nation Turns 250April 09, 2026New population estimates show women still outnumbered men at older ages, but the gap is narrowing due to lower mortality rates and historical factors.
-
Business and EconomyState Lottery Ticket Sales Soar as Prizes Get LargerApril 08, 2026While sales nearly doubled to $104.7 billion from 2008 to 2024, state lottery prizes more than doubled to $70.2 billion in FY 2024.