
Employment-Based Health Insurance Declines for Working-Age Adults During Pandemic
Private health insurance coverage declined for working-age adults ages 19 to 64 from early 2019 to early 2021, when the nation experienced the COVID-19 pandemic.
A report released today primarily examines health insurance coverage in the United States in calendar year 2020. However, the Current Population Survey Annual Social and Economic Supplement (CPS ASEC) also measures current coverage, or health insurance coverage held at the time of the survey interview.
The fall in private coverage, by 0.8 percentage points to 71.8%, was driven by a drop in employer-sponsored insurance of 0.6 percentage points to 61.6%.
Although this measure cannot predict coverage in a given calendar year, it offers a snapshot of health insurance coverage early in the year when CPS ASEC data are collected.
Looking at current coverage for adults ages 19 to 64 helps us understand some of the impact the COVID-19 pandemic had on health insurance coverage. We focus on working-age adults because they were more vulnerable to job loss during the recession and periods of high unemployment in 2020 and 2021.
We compare current coverage for adults ages 19 to 64 collected in early 2019 — the year before the COVID-19 pandemic necessitated changes to CPS ASEC data collection — to current coverage in early 2021, after many of those changes were removed.
We explore shifts in private coverage, such as health insurance people receive from their employers or purchase directly from an insurance company, a broker or the health insurance Marketplace.
We also look at changes in public insurance, such as Medicaid (for those with low incomes or disabilities) and Medicare (health insurance for those 65 and older and certain people under age 65 with long-term disabilities).
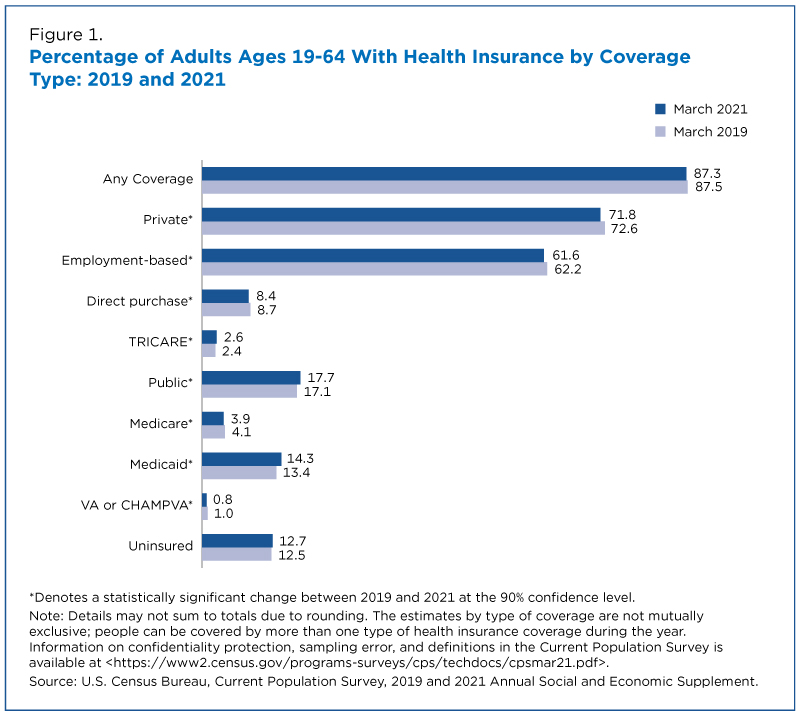
There was no change in the overall rate of health insurance coverage between early 2019 and early 2021 (Figure 1). However, there were changes in the types of coverage.
A decrease in private coverage during this period was partly offset by an increase in the percentage of working-age adults covered by public insurance programs such as Medicaid. As a result, the uninsured rate for adults ages 19 to 64 in early 2021 (12.7%) was not statistically different than in early 2019.
The fall in private coverage, by 0.8 percentage points to 71.8%, was driven by a drop in employer-sponsored insurance of 0.6 percentage points to 61.6%.
This finding is consistent with employment reports showing that many people lost their jobs during the COVID-19 pandemic. As a result, some may also have lost their health coverage.
By early 2021, 17.7% of adults ages 19 to 64 were covered through public insurance programs. Between early 2019 and early 2021, Medicaid coverage increased by 0.9 percentage points to 14.3%, consistent with reports of increased Medicaid enrollment throughout 2020.
Current Private Coverage by Income-to-Poverty Level
Health insurance and type of coverage are associated with a family’s income-to-poverty ratio, a measure of a family’s economic resources.
Family resources may determine the ability to afford private health insurance and families below certain income-to-poverty thresholds may qualify for public health insurance options.
People are classified as being in poverty if their family income is less than 100% of the poverty threshold. In 2020, the poverty threshold for a family with two adults and two children was $26,246.
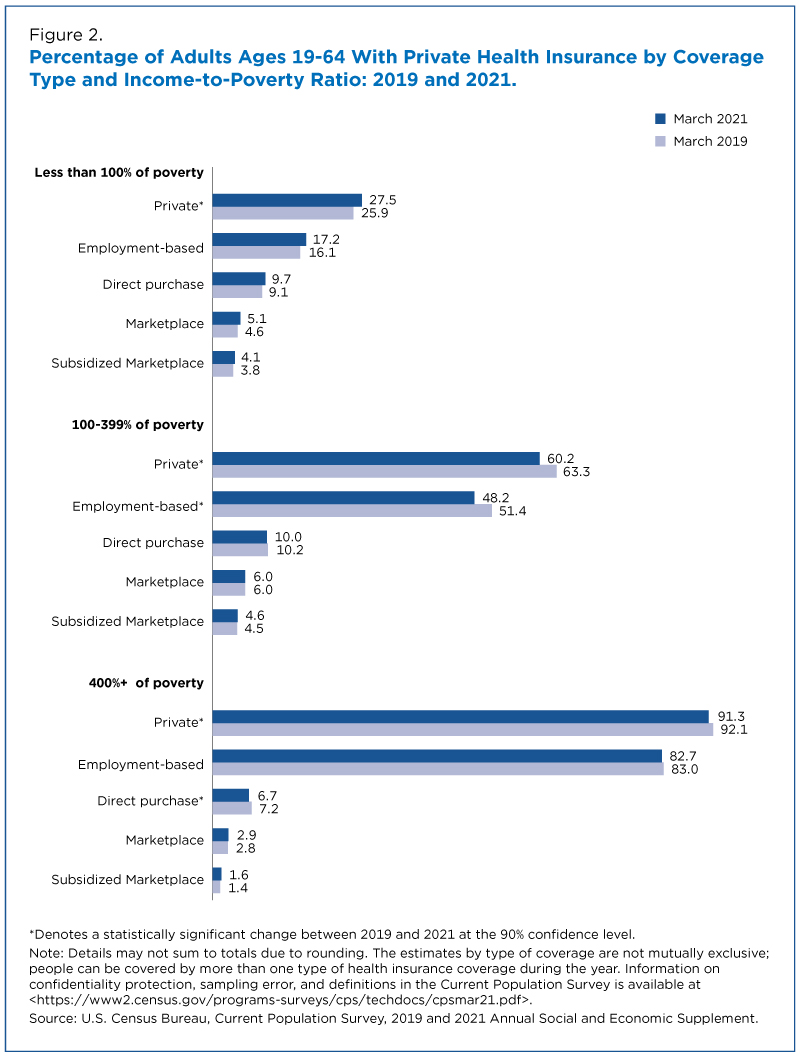
The changes in coverage shown in Figure 1 were not equally distributed among working-age adults in different income-to-poverty categories.
Private coverage rates fell for those with incomes above the poverty level: by 3.1 percentage points for adults ages 19 to 64 with family incomes up to 399% of the poverty level, and by 0.8 percentage points for those with family incomes at or above 400% of poverty (Figure 2).
Although employer-sponsored coverage for those with incomes above 400% of poverty didn’t decrease, the percentage of people in that group who directly purchased health insurance declined by 0.5 percentage points.
Between 2019 and 2021, private coverage rates among working-age adults in poverty jumped by 1.6 percentage points to 27.5% while public coverage for this group declined (Figures 2 and 3).
Current Public Coverage by Income-to-Poverty Level
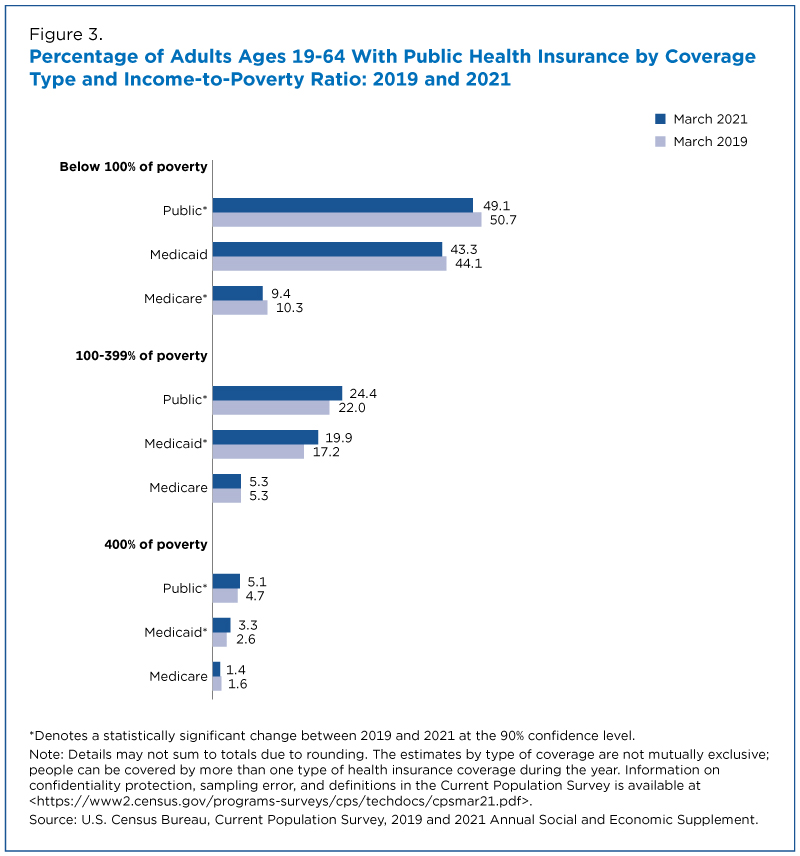
Changes in public coverage affected various income-to-poverty groups unevenly.
Medicaid coverage increased among people with incomes between 100% and 399% of poverty and at or above 400% of poverty by 2.7 percentage points and 0.6 percentage points, respectively (Figure 3).
Although public coverage rates declined among people in poverty, there was no statistical change in the percentage of people in this group covered through Medicaid between 2019 and 2021.
In 2021, people in poverty were still more likely to be covered by Medicaid (43.3%) than those with income-to-poverty ratio between 100% and 399% (19.9%) and those with income-to-poverty ratio above 400% (3.3%).
The calendar-year coverage estimates released in today report provide the primary measure of health insurance coverage in 2020. But the current coverage estimates offer another window into pandemic-related coverage changes.
Katherine Keisler-Starkey is an economist and Laryssa Mykyta is chief of the Census Bureau’s Health and Disability Statistics Branch.
Income, Poverty and Health Insurance in the U.S.
Subscribe
Our email newsletter is sent out on the day we publish a story. Get an alert directly in your inbox to read, share and blog about our newest stories.
Contact our Public Information Office for media inquiries or interviews.
-
America Counts StoryWho Was Lifted Out of Poverty by Stimulus Payments?September 14, 2021Supplemental Poverty Measure shows that the first two rounds of stimulus payments during the pandemic helped pull 11.7 million people out of poverty in 2020.
-
America Counts StoryDid Unemployment Insurance Lower Official Poverty Rates in 2020?September 14, 2021Expanded unemployment insurance benefits and eligibility during the pandemic lowered the overall poverty rate by 1.4 percentage points to 11.4% in 2020.
-
America Counts StoryPandemic Earnings Decline but Increase for Full-Time, Yearly WorkersSeptember 14, 2021How could earnings for full-time, year-round workers go up while earnings fell for all workers? There were fewer low-wage full-time, year-round workers.
-
America Counts StoryUninsured Rates for Children in Poverty Increased 2018–2020September 14, 2021Changes in children’s health coverage varied by poverty status from 2018 to 2020.
-
America Counts StoryUnderstanding Equity Through Census Bureau DataSeptember 14, 2021U.S. Census Bureau surveys and programs provide insight into social, economic and housing equity gaps in the United States.
-
PopulationMeasuring Foreign-Born Population Over Nation’s 250-Year HistoryJuly 21, 2026Historical census data document changes in the foreign-born population in both numbers and countries of origin.
-
Business and EconomyA Road Trip Across the Vacation EconomyJuly 14, 2026The Census Bureau rings in the summer with a travel statistics road map.
-
HealthWhere You Live Matters for Your Health and So Does How We Measure ItJuly 09, 2026Census Bureau research helps policymakers and researchers identify the most reliable ways to predict health outcomes and distribute resources accordingly.
-
PopulationU.S. Fertility Continues to Drop but Still High in Some CountiesJune 25, 2026Counties with the highest numbers of births have some of the lowest fertility rates.