
end of header
History
You are here: Census.gov › History › Home Page Archive › 2022 › September 2022
2022
September 2022
Visit https://www.census.gov/history every month for the latest Census History Home Page!
U.S. Census Bureau History: America's First Subway
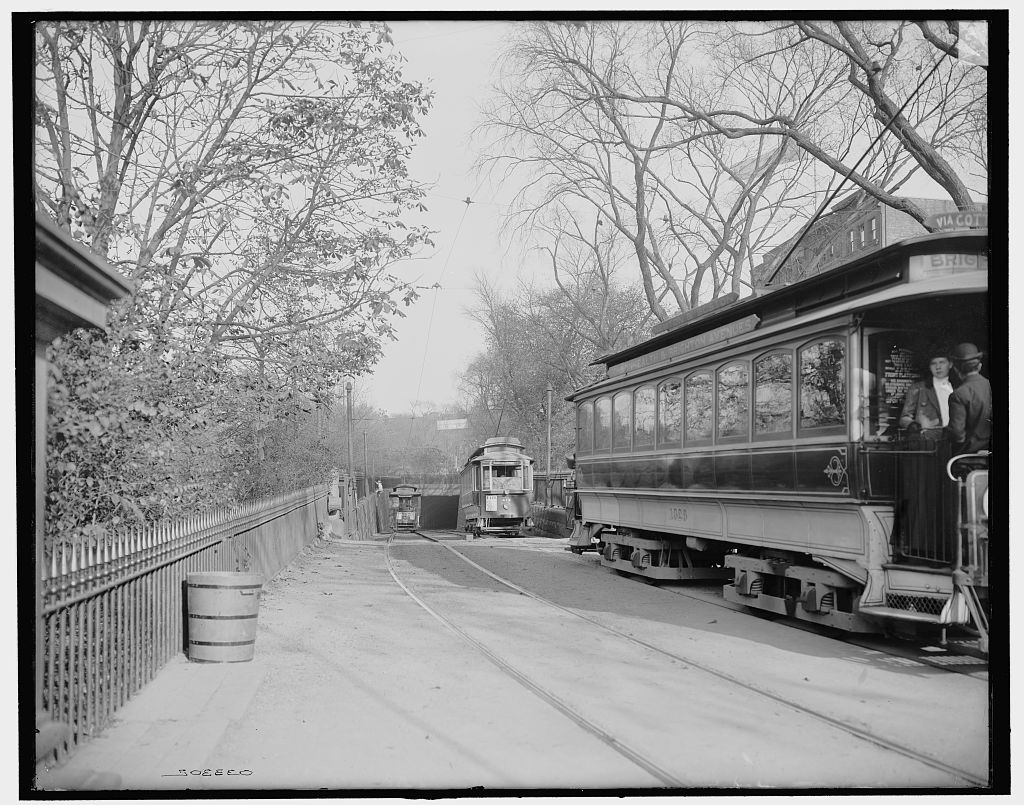
Boston, MA, opened the nation's first underground, electric subway line on September 1, 1897.
The earliest sections included branches that extended to the Boston Public Gardens [above]
along a route known as the "Tremont Street Subway" in the heart of the city.
Photo courtesy of the Library of Congress.
On September 1, 1897, the first underground subway in the United States opened in Boston, MA. Known as the "Tremont Street Line," the half-mile long route initially connected three underground stations to the city's existing above-ground street railway system. On opening day, more than 100,000 people paid 5 cents to take the 3- to 4-minute journey underneath Boston's streets. Today, subways in the United States and Puerto Rico carry an estimated 2.8 million workers aged 16 and over to work every day.
Rail transit to commute to and from Boston began as early as 1830 when the Boston and Lowell Railroad was chartered to provide steam rail service between Lowell and Boston, MA. Dozens of railways were soon establishing routes into Boston from outlying cities and towns. In March 1856, the Cambridge Horse Railroad started horse-drawn streetcar service between Harvard Square in Cambridge, MA—adjacent to Harvard University—and Boston's West End neighborhood. Like the steam railways, the number of streetcar companies plying the streets of Boston and its suburbs multiplied quickly. Horse-drawn trolleys, wagons, and the smelly manure they left behind soon jammed Boston's streets. In response, electric streetcars began replacing horse-drawn trolleys in 1889 and rail companies and the state legislature began planning commuter routes above and below the city's streets.
On March 28, 1895, dignitaries including Massachusetts Governor Frederick T. Greenhalge, broke ground for the nation's first underground subway during a ceremony at the Boston Public Garden. Workers utilized two construction techniques learned from building the subways in London, England, and Paris, France. The first method involved boring a "tube-like" tunnel—the origin of the London subway's "Tube" nickname—through the earth without disturbing traffic or buildings on the surface. A second "cut and cover" technique involved digging trenches, constructing steel beam and concrete tunnel walls with arched brick ceilings, and then filling in the excavation to bury the tunnel underground.
As construction progressed on the Tremont Street Subway, workers discovered they were digging through a forgotten part of Boston's Central Burying Ground. During the subway tunnel's excavation, they unearthed more than 900 graves dating back to the 1750s. Progress slowed again when a broken utility pipe filled the excavated "cut and cover" cavity beneath Boylston and Tremont Streets with gas. On March 4, 1897, a spark from a streetcar passing over the construction site ignited a tremendous explosion. The blast destroyed nearby streetcars, shattered windows for blocks around, injured dozens of pedestrians, and killed eight to ten people [depending on accounts] including: Reverend W.A. Start, who was standing on a nearby sidewalk; streetcar conductors Gilford D. Bigelow and Benjamin R. Sargent; public carriage driver Benjamin Downing and his passenger William L. Vinal; private carriage passenger A. M. Bates; William Mayvour, who was a waiter at the nearby Hotel Thorndike; and cab driver Delano Sibley.
Despite these setbacks, workers completed construction of the Tremont Street Subway early and under budget. In the next decade, New York City, NY (1904), and Philadelphia, PA (1907),  , followed Boston's example by moving their rapid transit rail systems underground.
Today, the original 1897 Tremont Street Line remains a vital component of the Massachusetts Bay Transportation Authority's subway system. The rapid transit system's "Green Line" carries more than 100,000 commuters through the historic tunnel every day between the Boylston and Government Center stations.
You can learn more about the history of our nation's railroads, rapid transit systems, and commuting patterns using census data and records. For example:
- The U.S. Census Bureau first collected detailed statistics on transportation—including steam railroads, steamboat companies, and incorporated express companies—in 1880. With a particular emphasis on railroads, the census incorporated specially-designed questionnaires that asked hundreds of questions to collect data on the railroads' financial and physical characteristics. Data published in the 1883 Report on the Agencies of Transportation in the United States, showed that total railroad track mileage built and completed grew from 39.8 miles in 1830 to 20,198.99 miles in 1855 and reached 87,801.42 miles at the time of the 1880 Census. Total permanent investment for track, equipment, building, land, etc., by railroad companies in the United States was nearly $5.2 billion at the time of the census. Asset and debt data were available for railroads large and small. For example, the giant New York Central and Hudson River Railroad Co., had assets of more than $121.6 million from construction; $19.5 million in equipment; nearly $1.2 million in land; more than $1.7 million in cash; and total liabilities (including stock, loans, dividends, etc.) of $149.4 million. Meanwhile, the tiny North Brookfield Railroad Co., in North Brookfield, MA, had assets of $105,456.79 from constructing its 4.16 mile branch line in 1876, $0 in equipment, $83.38 in cash, and liabilities of $105,615.17.
- The 1890 Census expanded coverage of rail transportation by collecting data from cities' rapid-transit facilities, including railways powered by animals, cable, and electricity. The August 23, 1890, Census Bulletin: Transportation—Rapid Transit in Cities reported that the 286 street railroads responding to the census had a total length of 3,150.93 miles. Animals (usually horses) powered more than 74 percent of these railways. In 1890, animal power was used on 2,351.10 miles; electricity on 260.36 miles; cable on 255.87 miles; and steam on 61.79 miles of elevated and 221.81 miles of surface roads. Philadelphia, PA, led the nation for total rail line length with 283.47 miles, followed by Boston, MA, with 200.86 miles, and Chicago, IL, with 181.78 miles.
- The Census Bureau conducted its first census of street and electric railways in 1902. Data showed that between 1890 and 1902, the number of street and electric railways grew from 789 to 987. The number of fare passengers grew from 2,023,010,202 in 1890 to 4,774,211,904 in 1902. One of the greatest changes in the 12 years between the 1890 and 1902 railway censuses was the way systems powered their railways. In 1890, animals (usually horses) powered railcars on 4,061.94 line miles while electricity powered 914.25 line miles. By 1902, electricity powered 16,230.62 line miles compared to just 195.21 line miles using animals; 113.93 line miles using cable; and 111.82 line miles using steam. Additional data and historical information about the construction and growth of the nation's street and electric railways are available in the Census Bureau's Street and Electric Railways Part 1 and Part 2.
- One drawback of the rapid growth of street and electric railways between 1890 and 1902 was the dangers this traffic posed to pedestrians who were not accustomed to dodging rapidly moving and difficult to stop railcars. In 1902, 1,217 people were killed and 47,429 people were injured in street railway accidents. By comparison, the Federal Railroad Administration reported 239 fatalities in 2021.
- Forty years after Boston's Tremont Street subway opened, the Census Bureau conducted the 1937 Census of Street Railways, Trolley-bus, and Motorbus Operations. As automobiles like the Ford Model T became increasingly affordable and the nation's roads improved, the need for street railways declined. In 1917, there were 1,200 in 1922, 706 in 1932. By 1937, the number of railway companies had fallen to 478. Passenger traffic fell from 14.1 billion in 1927 to 9.4 billion, 10 years later. As the number of street railways and passenger traffic decreased, so too did the number of street railway employees. The number of salaried and wage-earning employees decreased by 35.1 percent, from 27,845 in 1927 to 18,068 in 1937.
- The 1960 Census was the first to ask respondents about their place of work and how they commuted to their place of employment. These data helped governments better understand commuting patterns to determine road, highway, and transit spending; locate future transit station locations; and target areas for housing or business development, etc. The Census Bureau published its supplementary report Place of Work and Means of Transportation to Work in January 1963. The report showed that about 83 percent of the workers living in the central cities of standard metropolitan statistical areas (SMSA) of 100,000 or more at the time of the 1960 Census also worked in these central cities; about 9 percent commuted to the outlying suburban ring, while and 2 percent worked outside the area. Transportation to work data showed that New York City, NY, was the only SMSA where more than half of workers (54.8 percent) used public transportation to go to work. Other SMSAs with large percentages of people using public transportation to travel from home to work included Boston, MA (25.1 percent); Jersey City, NJ (39.6 percent); New Orleans, LA (32 percent); Philadelphia, PA (27.5 percent); and Washington, DC (23.7 percent).
- Although data about the number of people using carpools to commute to work had been asked in previous censuses, the 1980 Census collected more detailed data about carpools. That year, more than 19 million people carpooled, including 13.3 million in a 2-person carpool; more than 3.3 million in 3-person carpools; 1.4 million in 4-person carpools; and 1 million commuted in 5-or-more-person carpools.
- The 1990 Census was first to inquire about workers' usual time leaving their home to go to work. In 1990, 54.8 percent of all workers 16 years and over (61,194,181) left home for work between 6:30 a.m. and 8:29 a.m. In 2020, American Community Survey estimates reported that 24.1 percent of the nation's 142,512,559 workers 16 years and over who did not work from home departed for work sometime after the "traditional" morning rush between 9:00 a.m. and 11:59 p.m. During the morning hours in 2020, the largest cohort of commuters—14.6 percent—left between 7:00 a.m. and 7:29 a.m.
- The 1990 Census was the first to ask about workers' usual time spent traveling to work. Of the 111,664,249 workers 16 years and over who did not work at home in 1990, the majority (19,026,053) had travel times between 15 and 19 minutes to work. Long commutes of 90 minutes or more were usual for 1,763,991 people, while the average travel time for all workers not working at home was 22.4 minutes. Ten years later, the majority of workers not working at home still had commutes of 15 to 19 minutes (19,634,328), but the number of people reporting commutes of more than 90 minutes rose to 3,435,843 and average time to work increased to 25.5 minutes.
- In 2000, 75.7 percent of workers 16 years and over drove to work alone; 12.2 percent carpooled; 4.7 percent used public transportation; 2.9 percent walked; and 1.2 percent rode a motorcycle, bicycle, or had another means of transportation to work. More recently, 2020 American Community Survey estimates revealed that nearly 75.4 percent of the nation's 152,193,868 workers 16 year and over drove to work alone; more than 8.8 percent carpooled; about 4.6 percent used public transportation; 2.2 percent walked; and 1.8 percent usually took a taxi, motorcycle, bicycle, or other mode of transportation to work. As the technology has made working from home easier, the number of people 16 years and over reporting they worked from home rose from 3,406,025 in 1990 to 10,940,462 in 2020.
- Many villages, towns, and cities in the United States are named for the train stations they grew up around. Along with towns like Railroad, PA, and Railroad, IN, rail-related places include: Lake Station, IN, which was the western terminus of the Michigan Central Railroad; Fairfax Station, VA, so named because it was a stop on the Orange and Alexandria Railroad; Johnson Siding, SD, named for the rail siding that ran through the area along the Rapid City, Black Hills and Western Railroad; Cook Station in Crawford County, MO, named after becoming a stop on the St. Louis and San Francisco Railway; Laury's Station, PA, named for the town's first station agent and postmaster when the Lehigh Valley Railroad opened a train station in the town previously named "Slate Dam"; Yeehaw Junction, FL, named for the Florida East Coast Railway's Yeehaw Station; and Huntington Station, NY, named for the Long Island Railroad station that opened in the community in 1868.
- The Census Bureau's report Commuting by Public Transportation in the United States: 2019 featured data collected from the American Community Survey. Data from the survey's question, "How did this person usually get to work LAST WEEK?" showed that 5 percent of workers 16 years and over (7,778,444) used public transportation, including: 3,601,403 taking the bus; 2,935,633 riding the subway or elevated rail; 921,391 boarding long-distance train or commuter rail; and 242,776 commuting by light rail, streetcar, or trolley.
- Data from the Census Bureau's County Business Patterns series showed that in 2020 there were 674 urban transit systems (NAICS 4851) in the United States. Urban transit systems include establishments primarily engaged in operating local and suburban passenger transit systems such as light rail, subways, streetcars, and buses. These establishments employed 53,911 employees during the pay period that included March 12, 2020.
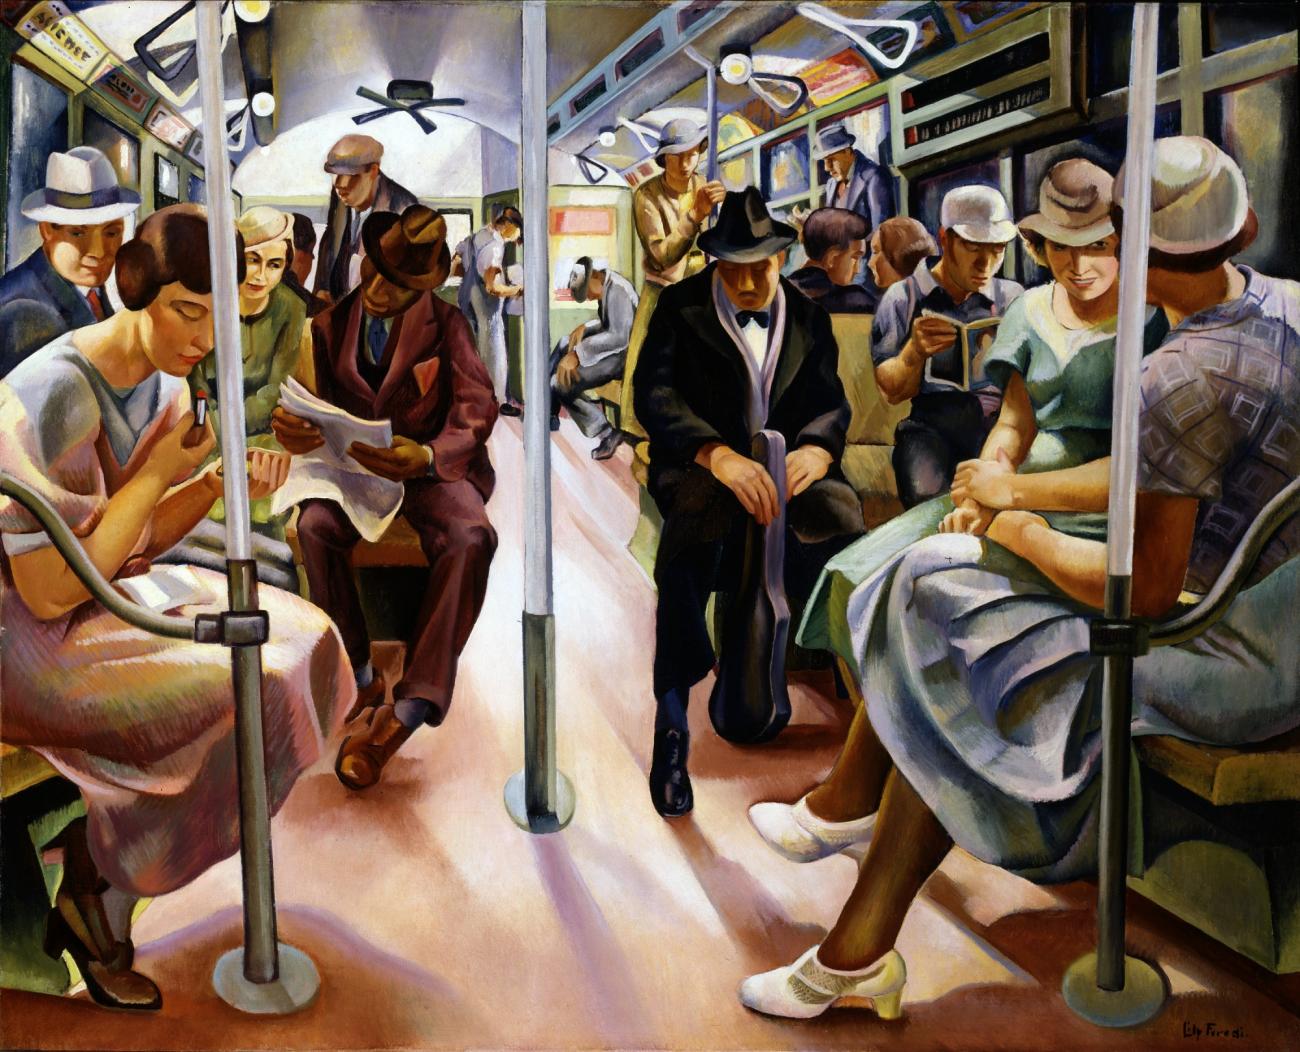
President Franklin D. Roosevelt's Works Progress Administration (WPA) commissioned artist Lily Furedi to paint "Subway" depicting New York City, NY, commuters in 1934. The WPA
paid artists to paint and sculpt works that used the nation’s land and people for their subjects.
In 1935—1 year after Furedi painted "Subway"—approximately 1.8 billion passengers rode the New York City Subway. More recently, the Metropolitan Transit Authority reported that
prior to the COVID-19 pandemic, nearly 1.7 billion passengers rode the subway in 2019.
Photo courtesy of the Smithsonian Institution.
This Month in Census History
In a report by Census Bureau director James C. Capt on September 12, 1942, the 1940 Census of Housing found that 15 million American homes had a refrigerator; 9.2 million used ice boxes; and more than 9.3 million homes had no type of refrigerating equipment.
By 1950, more than 33.7 million homes had electric- or gas-powered mechanical refrigerators.
In 2011, the Survey of Income and Program Participation showed that 99.2 percent of American households had mechanical refrigeration.

View larger image
Subway Systems
Boston, MA, opened the first subway in the United States in September 1897, but within a decade, it was surpassed in length and ridership by the New York City Subway—the largest subway system in the United States.
New York City's first subway—the "Manhattan Main Line"—opened on October 27, 1904, and transported riders between city hall and Harlem's 145th Street. After more than a century of growth, New York's 248-mile-long subway system carries 1.7 billion passengers annually.
Subways in Washington, DC, and Chicago, IL, are the nation's second and third largest systems. In 2019, Washington's 117-mile Metro carried nearly 238 million passengers, while Chicago's 102.8-mile "L" carried more than 218 million.
In Boston, MA, the Tremont Street Tunnel that opened on September 1, 1897, is still used by the region's subway system. In 2019, the 38-mile-long "T" carried more than 152 million passengers.
The newest—and shortest—subway line in the United States can be found in San Juan, Puerto Rico. The 10.7-mile Tren Urbano system opened in 2004 and carried more than 5.2 million passengers in 2019.
Worldwide, Shanghai, China, had the longest and busiest subway system in 2019. More than 10.6 million people ride the 499-mile-long Shanghai Metro every weekday!

View larger image
Did you know?
Alfred Ely Beach designed his "Beach Pneumatic Transit" in the 1860s and secretly constructed it beneath New York City's congested Broadway Avenue in 1869 using a tunneling device of his own invention. On February 26, 1870, Beach began offering rides along the 300 foot long test track.
Despite positive reviews, city politicians were reluctant to approve an expansion of the subway. Financier John Jacob Astor III argued construction would damage buildings and worsen surface traffic. When New York governor John Adams Dix finally signed a bill chartering Beach's pneumatic railway in 1873, the Panic of 1873 and advances in electric motors ended Beach's air-driven railway dreams.
More than 2 decades later, a growing population and gridlocked streets convinced New Yorkers to invest in underground transit. Approved in 1894, the New York City Subway opened its first underground segment on October 27, 1904. On its first day, it carried more than 150,000 people along its 9.1 mile route.
Today, New York's subway is the largest and busiest subway system in the United States.
 Yes
Yes
 No
No
Comments or suggestions?