Emergency Management Coastal Areas
Emergency Management Coastal Areas
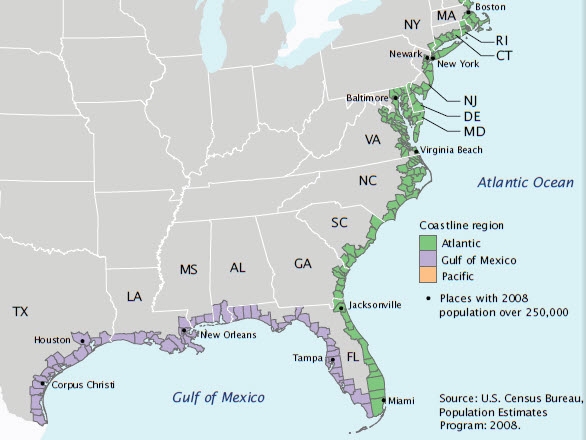
The growth in population of coastal areas illustrates the importance of emergency planning and preparedness for areas that are susceptible to inclement tropical conditions. The U.S. Census Bureau’s official population estimates, along with annually updated socioeconomic data from the American Community Survey, provide a detailed look at the nation’s growing coastal population. Emergency planners and community leaders can better assess the needs of coastal populations using census data.
This historical report uses a combination of decennial census data and population estimates to examine population trends along the country’s saltwater edges — the nation’s coastline counties.
Between 1960 and 2008, the population in coastline counties along the Gulf of Mexico soared by 150 percent, more than double the rate of increase of the nation's population as a whole. This area is now home to nearly 14 million residents.
Eighty-seven million people, or 29 percent of the U.S. population, live in coastline counties, including more than 41 million in Atlantic and 32 million in Pacific counties. In 1960, only 47 million lived in coastline counties, an increase of 40 million.
Additional Information on Coastal Areas
Coastline counties along the Atlantic and Gulf of Mexico coasts as well as the Hawaiian Islands account for nearly two-thirds of the nation's coastline population and are home to four of the nation's 10 most populous counties. These counties are also vulnerable to one of nature's biggest threats: hurricanes.
What is a Coastal County?
As defined by the US Census Bureau: a coastal county has to be adjacent to water classified as either coastal water or territorial sea. There are 254 coastline counties, stretching across parts of 23 states and covering 561,435 square miles. Coastline counties are located in three coastline regions: the Atlantic (129 counties), Gulf of Mexico (56 counties), and Pacific (69 counties).
Population Growth in Coast Counties
The coastal population grew by 40 million people between 1960 and 2008, an 84.3% increase.
| Year | Coastal Population |
|---|---|
| 1960 | 47.4 million |
| 1970 | 56.7 million |
| 1980 | 63.6 million |
| 1990 | 73.0 million |
| 2000 | 82.1 million |
| 2008 | 87.4 million |
Percentage Increases in Coast and Non-coastal Population by Time Period
| Time Period | Coastal | Non-coastal |
|---|---|---|
| 1960 to 1970 | 19.5 | 11.1 |
| 1970 to 1980 | 12.1 | 11.2 |
| 1980 to 1990 | 14.9 | 7.8 |
| 1990 to 2000 | 12.4 | 13.5 |
| 2000 to 2008 | 6.5 | 8.7 |
The overall population increased between 1960 and 2008 was 84.3% for coastal areas and 64.3% for non-coastal areas.
Demographic Components of Population Change: 2000 to 2008
The 5.3 million coastal population increase was due entirely to natural increase (births minus deaths) and international migration.
| International migration | +3.9 million |
|---|---|
| Domestic migration | -3.5 million |
| Natural increase | +4.5 million |
Housing Units in Coastal
The number of housing units along the coastline increased in recent decades, from 16.1 million in 1960 to 36.3 million in 2008. During this period, the Atlantic coastline region gained the largest number of housing units (8.8 million), followed by the Pacific (6.8 million) and the Gulf of Mexico (4.5 million).
Between 1960 and 2008, the percentage increase in housing units along the coastline (126 percent) was greater than that of the United States (121 percent) or for non coastline counties (120 percent). Among the coastline regions, the total percentage increases in the Gulf of Mexico (246 percent) and the Pacific (130 percent) far outpaced the gains for the Atlantic region (98 percent).
Source: U.S. Census Bureau, Decennial Census of Population and Housing: 1960 to 2000; Population Estimates Program: 2008.
Coastline Counties Most Frequently Hit by Hurricanes: 1960 to 2008
| Rank | County | State | Numbers of Hurricanes |
Percent Change 1960 to 2008 |
Percent Change 2000 to 2008 |
|---|---|---|---|---|---|
| 1 | Monroe County | FL | 15 | 50.8 | -9.2 |
| 2 | Lafourche Parish | LA | 14 | 67.2 | 2.9 |
| 2 | Carteret County | NC | 14 | 104.3 | 6.4 |
| 4 | Dare County | NC | 13 | 465.9 | 12.1 |
| 4 | Hyde County | NC | 13 | -10.1 | -11.1 |
| 6 | Jefferson Parish | LA | 12 | 108.9 | -4.2 |
| 6 | Palm Beach County | FL | 12 | 454.7 | 11.9 |
| 8 | Miami-Dade County | FL | 11 | 156.5 | 6.4 |
| 8 | St. Bernard Parish | LA | 11 | 17.2 | -43.9 |
| 8 | Cameron Parish | LA | 11 | 4.8 | -27.6 |
| 8 | Terrebonne Parish | LA | 11 | 78.7 | 3.9 |
The 10 most intense hurricanes since 1960 affected nearly 51 million people living in coastline counties. If those same 10 hurricanes had struck in 2008, the coastline population affected would have been closer to 70 million. Coastline counties affected by Hurricane Katrina (2005) had an overall decrease in population (nearly 2 percent loss). The populations in coastline counties affected by Hurricanes Andrew (1992) had grown by more than 20 percent.


