An official website of the United States government
Here’s how you know
Official websites use .gov
A .gov website belongs to an official government organization in the United States.
Secure .gov websites use HTTPS
A lock (
) or https:// means you’ve safely connected to the .gov website. Share sensitive information only on official, secure websites.
-
//
- Census.gov /
- Topics /
- Population /
- Racial and Ethnic Diversity /
- About
About Racial and Ethnic Diversity
About Racial and Ethnic Diversity
The concept of racial and ethnic diversity refers to representation and the relative size of different racial and ethnic groups within a population. Diversity is maximized when all groups are represented in an area and have equal shares of the population.
We have used several approaches to measure the racial and ethnic diversity of the U.S. population in the 2020 Census results. These include:
- Diversity Index.
- Prevalence rankings and diffusion score.
- Prevalence maps.
These diversity calculations require the use of mutually exclusive racial and ethnic (nonoverlapping) categories.
The following groups are used in the diversity calculations:
- Hispanic
- White alone, non-Hispanic
- Black or African American alone, non-Hispanic
- American Indian and Alaska Native alone, non-Hispanic
- Asian alone, non-Hispanic
- Native Hawaiian and Other Pacific Islander alone, non-Hispanic
- Some Other Race alone, non-Hispanic
- Multiracial, non-Hispanic
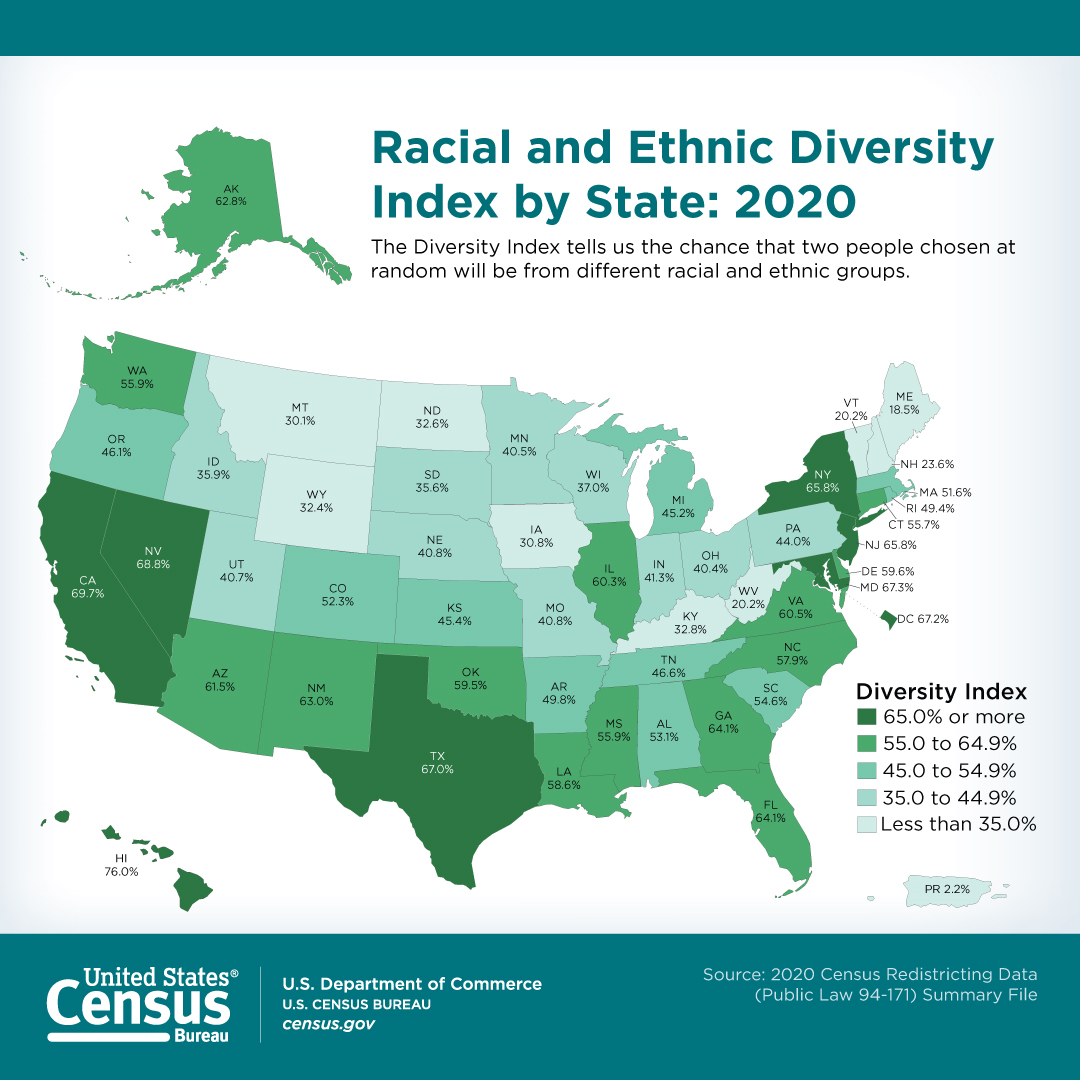
The diversity index tells us how likely two people chosen at random will be from different race and ethnicity groups. A value of 0 indicates that everyone in the population has the same racial and ethnic characteristics. A value close to 100 indicates that almost everyone in the population has different racial and ethnic characteristics.

The prevalence ranking depicts the percentage of the population that falls into the top three largest racial or ethnic groups. The diffusion score measures the percentage of the population that is not in the first-, second- or third-largest racial and ethnic groups combined. The higher the diffusion score, the less concentrated the population in the three largest racial or ethnic groups.

Prevalence maps show the geographic distribution of the largest, second largest or third largest racial or ethnic group at a specific geographic level. These maps often reveal regional patterns in how the U.S. population is spatially distributed by race and ethnicity.

Share
 Yes
Yes
 No
NoComments or suggestions?


Top

