Model-Based Methodology for the 1990 Census
Model-Based Methodology for the 1990 Census
We have created this page to help you figure out how to use these statistics. The guidance may explain which data sources to use and how to make comparisons. Related sites may offer further information.
Model-Based Estimates of the Prevalence of Specific Disabilities by State and County: A Note on Methodology
Data providers are frequently asked for information on the prevalence of specific disabilities for states, counties, and places. The only data source for direct information at these geographic levels is the decennial census. The decennial data on the prevalence of work disabilities, mobility limitations, and self-care limitations are widely used, but there is a strong underlying demand for additional data that are more specific.
The current project, the development of a model that provides estimates of the prevalence of specific disabilities at the state and county level, is based on (1), the CRS/census file containing records from the Content Reinterview Survey (CRS) and records for the same individuals individuals from the 1990 census, and (2), prevalence levels obtained from the Survey of Income and Program Participation (SIPP) during the period October 1991 - January 1992.
The CRS repeated the 1990 census questions on disability status, but also obtained information on the existence of more specific limitations including (1) difficulty seeing words and letters in ordinary newspaper print, (2) inability to see words and letters in ordinary newspaper print, (3) difficulty hearing what is said in a normal conversation with another person, (4) inability to hear what is said in a normal conversation with another person, (5) the use of an aid to help get around such as crutches, a cane, or a wheelchair, (6) difficulty walking a quarter of a mile, (7) inability to walk a quarter of a mile, (8) difficulty walking up a flight of stairs without resting, (9) inability to walk up a flight of stairs without resting, (10) difficulty lifting and carrying something as heavy as a full bag of groceries, and (11) inability to lift and carry something as heavy as a full bag of groceries.
The modeling process rests on the assumption that the variables that are available on the 1990 census file have sufficient explanatory power that it is possible to use these variables to make reasonable estimates of the probability that a person on the census file will have one of the specific disabilities of interest.
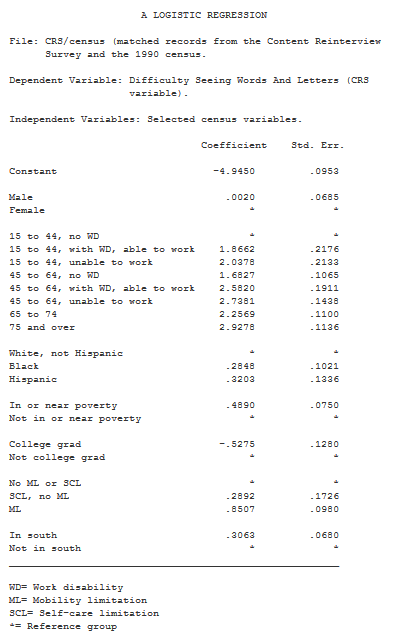
In order to obtain equations that calculate the probability that a person on the 1990 census file has difficulty seeing the words and letters in ordinary newspaper print (or has some other specific disability), we used the CRS/census file to fit logistic regressions.
An attached sheet shows the results of estimating a logistic regression when the dependent variable was "difficulty seeing the words and letters in ordinary newspaper print".
The regression results provided a "first stage" estimate of the probability that a person would have a specific disability. Because we had national estimates from SIPP that were based on a large sample, we used SIPP data to develop "second stage" factors. The process used the following steps:
- Fit a logistic regression using the CRS/census file.
- Use the results to estimate, for each person 15 and over on the full census file, the probability that the person has a specific disability.
- Sum the probabilities for the United States and compare the result with the SIPP estimate of the number of persons with the characteristic.
- Use the difference to develop a factor that adjusts probabilities at the level of the individual.
For example, when we first summed the probabilities that a person had difficulty seeing the words and letters in ordinary newspaper print, we obtained a total that was about 18 percent below the SIPP estimate. Based on this finding, we increased each person's probability of having difficulty seeing the words and letters in ordinary newspaper print by a factor of 1.1826.
Some disability categories required special treatment. Because there were relatively few persons in the CRS/census file who were unable to hear what is said in a normal conversation, the probability of being unable to hear was set at .0844 of the probability of having difficulty hearing (the factor was based on SIPP data). The CRS did not differentiate between persons who used wheelchairs and those who used other aids to get around, so SIPP data were used to assign the probability that a person who used aids used a wheelchair. Finally, the CRS did not have the full set of questions that are used in SIPP to obtain estimates of the total number of persons 15 plus with a disability and the total number of persons 15 plus with a severe disability. The following procedure was used to obtain the probability that a person had "any" disability:
- Set the probability of having any disability equal to the sum of the probabilities of having any specific disability.
- Use the results to estimate, for each person 15 and over on the full census file, the probability that the person had a any disability.
- Sum the probabilities for the United States and compare the result with the SIPP estimate of the number of persons with any characteristic.
- Use the difference to develop a factor that adjusts probabilities at the level of the individual.
The procedure to obtain the probability that a person had a "severe" disability was similar except that step 1 involved setting the probability of having a severe disability equal to the sum of the probabilities of having severe specific disabilities (severe specific disabilities included the inability to perform a function or the use of an aid to get around).


