
Official websites use .gov
A .gov website belongs to an official government organization in the United States.
Secure .gov websites use HTTPS
A lock (
) or https:// means you’ve safely connected to the .gov website. Share sensitive information only on official, secure websites.

Activities
Resources
Standards
About
May Classroom Resources Straight to Your Inbox!
Hooray, May is here! The Statistics in Schools (SIS) program is prepared to help you incorporate real-world data into your classroom with timely resources. From Asian American, Native Hawaiian and Pacific Islander (AANHPI) Heritage Month to Mother’s Day, we have something available that is sure to get your students interested in the month’s celebrations.
Asian American, Native Hawaiian and Pacific Islander Heritage Month

Did you know that May is Asian American, Native Hawaiian and Pacific Islander Heritage Month? Asians made up about 7.2% of the population in the United States in 2020. Learn interesting facts like this, along with birthplace populations of famous Asian-Americans, educational attainment levels, and more with our newly updated Fun Facts. The accompanying teaching guide provides ideas for how to incorporate the data into your classroom for discussion, from writing exercises to an advertising activity.
To add to the fun and get students in the competitive spirit, have your students play our Kahoot! game: Test Your Knowledge: Asian American, Native Hawaiian and Pacific Islander Heritage Month! They can use our related Fun Facts handouts to get clues to answers on questions on median age, Asian-owned businesses in the United States, and more.

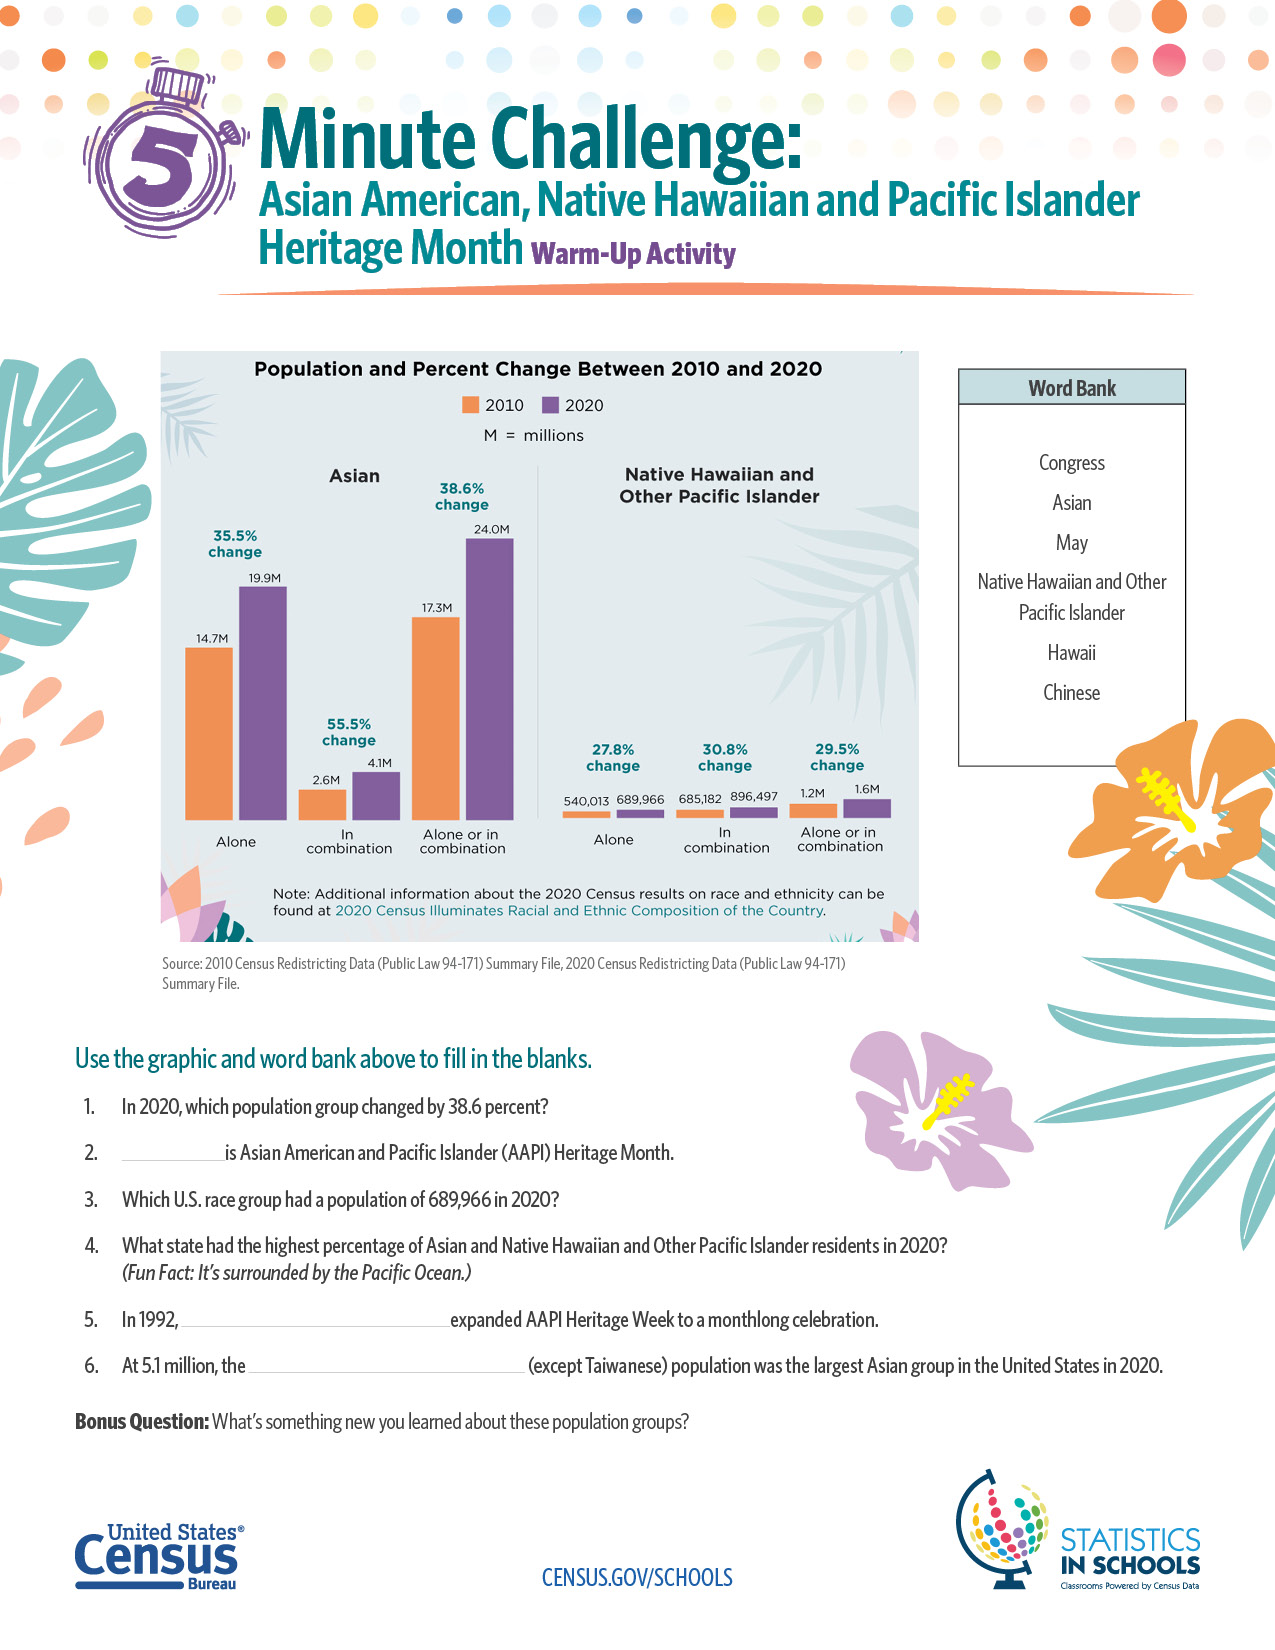
Last but not least, challenge students with our 5-Minute Warm-Up Challenge on this Heritage Month! This quick and easy activity has students analyze a graphic about the AANHPI population to learn facts and answer questions about what they’ve learned.
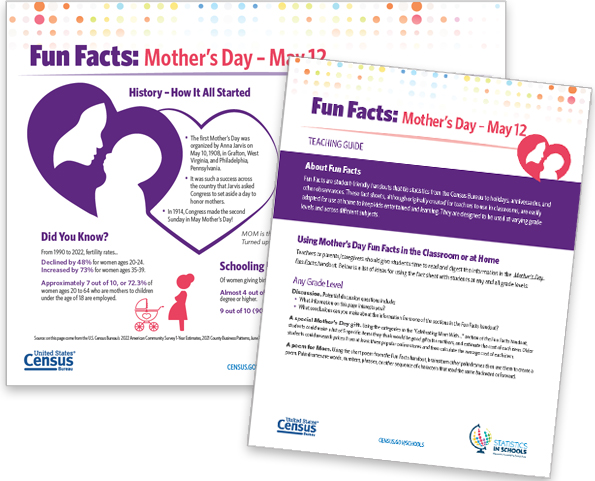
Mother’s Day – May 12
This Mother’s Day, give students the chance to share interesting mom-related statistics with their loved ones! For example, did you know that in 2022, out of every 100 women (by the ages 45 to 50), approximately 29% have three or more children? Students can learn more about how many children women have, along with educational attainment of mothers, and more. The accompanying teaching guide is full of fun activities like coming up with ideas for gifts and creating a card for a special woman in their lives.
Activity of the Month
SIS has a variety of standards-based activities that students in all grade levels can use in the classroom. In this section of our newsletter, an SIS staff member has handpicked one of their favorites for you to explore.
Numbers that Tell a Story

This month’s activity spotlight is on one of our middle school English activities, Numbers that Tell a Story. This staff favorite utilizes one of our most popular tools, State Facts for Students, that students will use to explore data about their state and voice their opinions on how population has changed over time. They will look at various data points including median age, how people get to work, businesses and more, and make opinion statements using the data. Then, they will have a chance to present their ideas to their peers to further the discussion.
Why is This Activity a Staff Favorite?
It gives students the chance to take a deeper dive into data on their own state! Giving students the opportunity to review real-world data on their immediate surroundings gives them a sense of how impactful different factors can be on their lives. For example, students can look at how many children their age live in their state, and how that number has changed over time. When students are learning about topics that are relevant to them, they can better relate and feel more engaged with discussion.
Page Last Revised - May 28, 2024
✕
Is this page helpful?
 Yes
Yes
 No
No
 Yes
Yes
 No
No✕
NO THANKS
255 characters maximum
 255 characters maximum reached
✕
Thank you for your feedback.
Comments or suggestions?

Comments or suggestions?