
Official websites use .gov
A .gov website belongs to an official government organization in the United States.
Secure .gov websites use HTTPS
A lock (
) or https:// means you’ve safely connected to the .gov website. Share sensitive information only on official, secure websites.

Activities
Resources
Standards
About
Share Fun Statistical Resources This March About Women’s History Month, Pi Day, Reading Across America, and More!
Celebrate this month’s observances with Statistics in Schools (SIS) resources! From elementary to high school, these classroom gems are full of fun interesting facts that help improve the statistical literacy of students while they explore things like the number of U.S. businesses owned by women, college completion at higher ages, and U.S. residents who speak Irish (known as Gaelic in Ireland).
And that’s not all! Be sure to check out our Activity of the Month, selected just for you by one of our SIS staff members!
Women’s History Month

Did you know in 2022, 53% of women voted, compared to 51.3% of men? Our Women’s History Month Fun Facts offers this and other fascinating facts about U.S. women from the number in STEM (science, technology, engineering, and mathematics) occupations to percentage of females living in the United States in 2022, and more. Begin a class discussion by asking students to name a woman in their lives or in history who did something that inspired or encouraged them. Use our accompanying teaching guide for classroom activity ideas at any grade level such as having students pretend to be a journalist reporting about women in STEM occupations; explore trends in marriage data to make educated guesses as to why new generations are getting married later; and discuss differences of the gender pay gaps within and across different occupations.
Making Herstory: Celebrating Women’s History Month
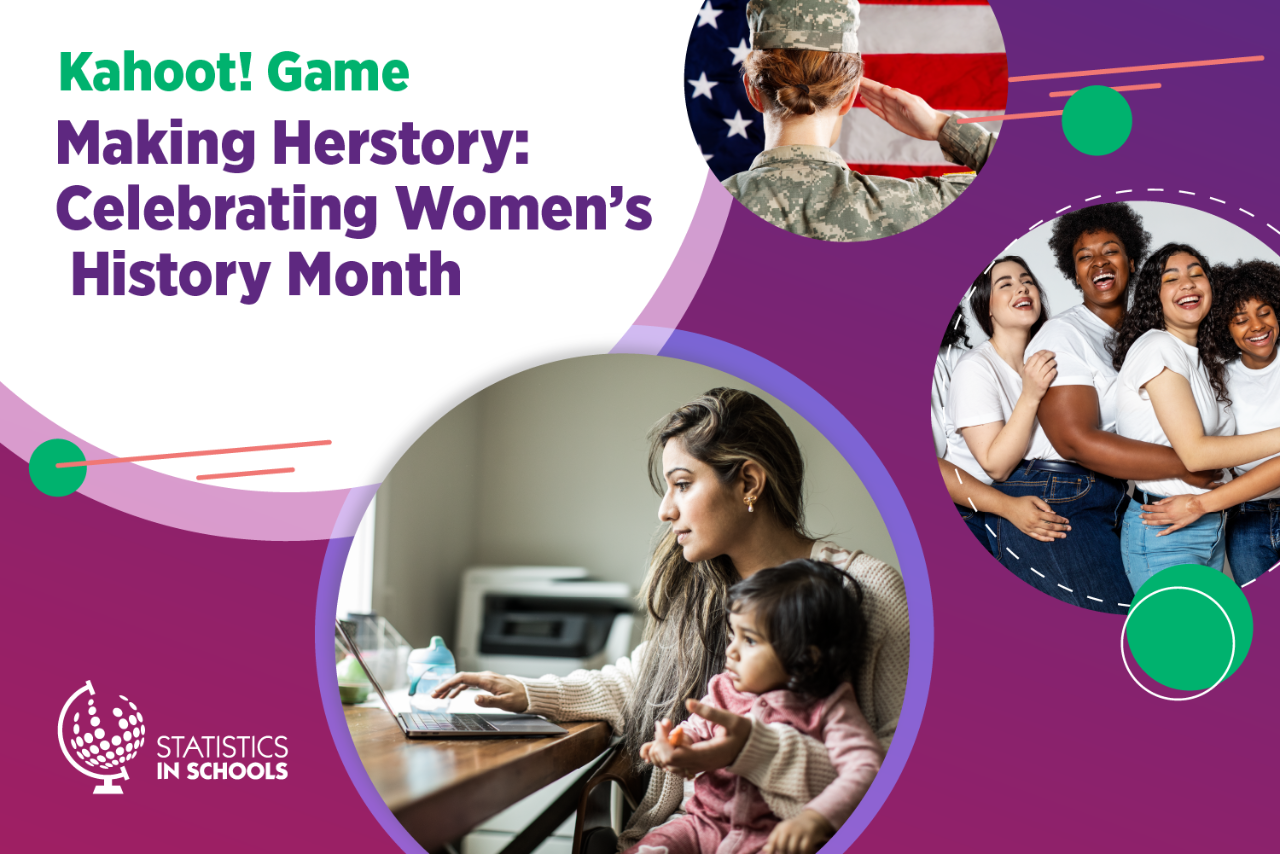
March is Women’s History Month! This observance traces its roots back to 1857, when women in New York City staged a protest over poor working conditions. Celebrate the advances women have made since then and test your knowledge about Census Bureau statistics highlighting American women today like the number of women-owned businesses and the share of women with a bachelor’s degree in the United States.
Women’s Roles in Antebellum America

Share our history activity for which students examine an 1850 Census questionnaire and 1851 political cartoon to learn about challenges women faced during the antebellum period (1832-1860).
Read Across America Day (March 2)

Curious how college completion rates have changed over time? In honor of Read Across America Day, have grade 11-12 students check out our English activity, Annotating Informational Text: College Completion Rates Through the Generations, which includes data on changes in college completion rates of people born in different years. Students will read an article, Over the Hill at 25? College Completion at Higher Ages; study the data; and answer questions designed to test their knowledge about what they read.
Pi Day (March 14)

Happy Pi Day! Have fun today sharing our Calculating with Scientific Notation – Comparing Populations activity. Students will review their state’s population from 1920 to 2020 then use the data to read and write numbers in scientific notation. What a way to commemorate this day!
St. Patrick’s Day – March 17
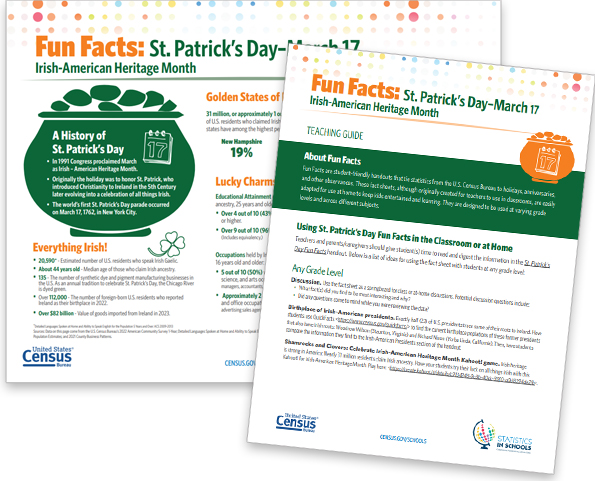
Did you know that 31 million U.S. residents claimed Irish ancestry in 2022? March is Irish-American Heritage Month and we have the perfect way to celebrate! Share cool data on all things Irish in our St. Patrick’s Day Fun Facts. This handout includes interesting stats from the estimated number of U.S. residents who speak Irish Gaelic to places across the country with lucky names. The accompanying teaching guide provides lots of ideas on activities you can do using the handout. For example, have students research U.S. places with Irish-like names; identify an annual tradition their state can start for St. Patrick’s Day; or develop an advertising campaign to celebrate the month.
Continue to celebrate this month with more engaging Irish-American SIS resources for students to enjoy!
Irish-Sounding Places
Did you know there are places called Lucky, WI (population 1,093) and Luck, LA (population 251)? Students will discover this and a whole lot more about Irish-sounding places around the country – and perhaps even in their own state – when they participate in our 5-Minute Warm-Up Challenge. For this activity, students examine and answer questions about Irish-sounding places across the country.
Where Irish Eyes Are Smiling in the United States
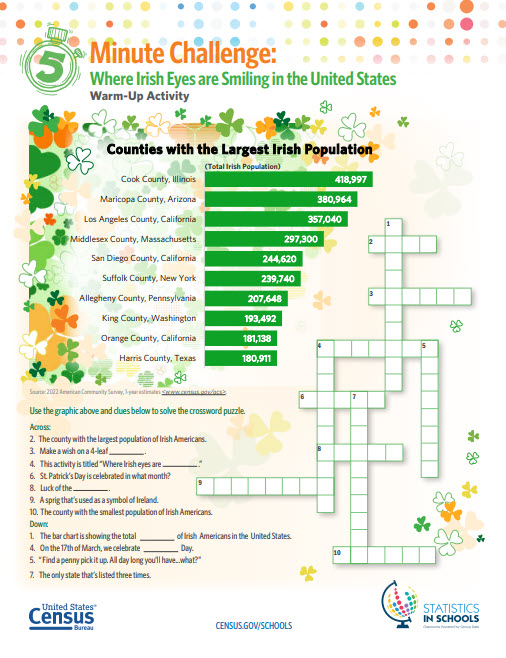
Did you know Cook County, IL had the largest Irish county population (418,997) in 2022? Challenge students’ knowledge and have them review our graph showing where Irish-Americans live and then complete our crossword puzzle with the information they discover.
Shamrocks and Clovers: Celebrate Irish-American Heritage Month
Irish heritage is strong in America: More than 31 million residents (1 out of 10) claimed Irish ancestry in 2022. Try your luck on all things Irish with this Kahoot! game about Irish-American Heritage Month. Answers come from Census Bureau data.
Activity of the Month
SIS has a variety of standards-based activities for all grade levels. In this section of our newsletter, an SIS staff member has handpicked one of their favorites for you to explore.
Any future photographers in your class? Our elementary school activity, Examining Changes to the Environment Through Pictures and Data, may spark an eye for photography while exploring famous U.S. landmarks and learning about changes in population and the number of businesses and houses over the years.


Why this activity is a SIS favorite…
It’s like time travel! Students compare photographs of the same location taken in the past and present to discover how human actions and population changes have impacted our environment over time. They will describe the changes they see like new bridges and roads, and how people responded to growing populations by doing things such as building new businesses and schools.
Plan ahead: Check out our resources for Kindergarten Day (April 21); Earth Day (April 22); Teacher Appreciation Week (May 6 to May 10); Mother’s Day (May 12); and Bike to Work Day (May 17). Use our Monthly Highlights page to plan your month!
Page Last Revised - March 5, 2024
✕
Is this page helpful?
 Yes
Yes
 No
No
 Yes
Yes
 No
No✕
NO THANKS
255 characters maximum
 255 characters maximum reached
✕
Thank you for your feedback.
Comments or suggestions?

Comments or suggestions?