
Official websites use .gov
A .gov website belongs to an official government organization in the United States.
Secure .gov websites use HTTPS
A lock (
) or https:// means you’ve safely connected to the .gov website. Share sensitive information only on official, secure websites.

Activities
Resources
Standards
About
Moving Into March With Statistical Resources
Moving Into March With Statistical Resources
Happy March! This month share Statistics in Schools (SIS) resources about Women’s History Month, Reading Across America, Pi Day and more. Our activities help improve the statistical literacy of students while they have fun exploring things like the number of U.S. businesses owned by women, college completion rates over time, scientific notations, and more.
Women’s History Month
Our new resources highlight women’s rights issues and statistics like the total population of women in the United States, the percent of women working in STEM (Science, Technology, Engineering and Mathematics) occupations and more. What better way to celebrate this month’s special events?
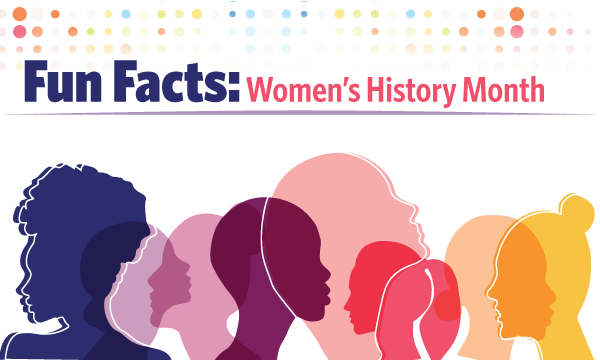
New Women’s History Month Fun Facts!
Did you know there were about 1.7 million more females than males ages 85 and older in the United States in 2021? This new SIS resource offers students fascinating facts about U.S. women.
Women’s Roles in Antebellum America
Share our history activity that examines an 1850 Census questionnaire and 1851 political cartoon to help students understand challenges women faced during the antebellum period (1832-1860).


Read Across America Day (March 2)
Curious how college completion rates have changed over time? In honor of Read Across America Day, have students check out our English activity, “Over the Hill at 25? College Completion at Higher Ages,” which includes data on changes in college completion rates of people born in different years. Students will study the data and answer questions designed to show how much they learned about what they read. What better way to spend this day than reading?
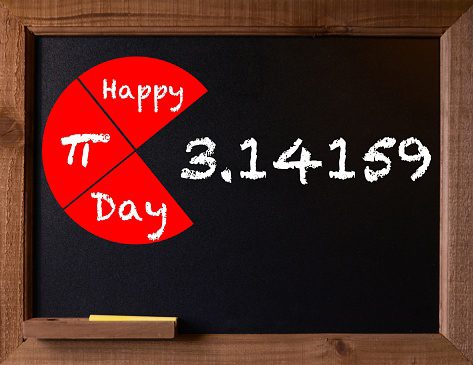
Pi Day (March 14)
Happy Pi Day! Have fun today sharing our Calculating with Scientific Notation – Comparing Populations activity. Students will look at the population of their state from 1920 to 2020 then use the data to read and write numbers in scientific notation. What a way to commemorate this day!
Page Last Revised - March 8, 2023
✕
Is this page helpful?
 Yes
Yes
 No
No
 Yes
Yes
 No
No✕
NO THANKS
255 characters maximum
 255 characters maximum reached
✕
Thank you for your feedback.
Comments or suggestions?

Comments or suggestions?