
Official websites use .gov
A .gov website belongs to an official government organization in the United States.
Secure .gov websites use HTTPS
A lock (
) or https:// means you’ve safely connected to the .gov website. Share sensitive information only on official, secure websites.

Activities
Resources
Standards
About
From June to July: Keep Learning this Summer with SIS Resources
As summer fast approaches, introduce students to Statistic’s in Schools (SIS) resources about Father’s Day, National Caribbean American Heritage Month, Fourth of July, National Ice Cream Day and more. Our resources help strengthen students’ statistical literacy skills while having fun exploring cool Census Bureau data like states with the most amusement parks or zoos and botanical gardens, the estimated number of fathers across the nation to how many ice cream and frozen dessert makers are in each state.
National Caribbean American Heritage Month

June is National Caribbean-American Heritage Month! Have students play our Kahoot! game to learn about all things Caribbean like the number of people with Caribbean or West Indian ancestry in the United States and the two U.S. metro areas with the highest concentration of people of Jamaican or Haitian ancestry.
Hurricane Season
Hurricane season begins June 1. Are you prepared? Share our Play It Safe geography activity with elementary school students to discover how the U.S. Census Bureau helps emergency responders provide support during natural disasters. Students can explore how people prepare and respond to environmental dangers and determine what items are needed to prepare for natural disasters in their community.

Father's Day – June 16

Father's Day is a time to express the gratitude and importance of fatherhood. Did you know there were an estimated 231,000 stay-at-home dads in the United States in 2023 and 20 percent (2 million) of the about 10 million parents living with their children under 18 (with no other parent living with them) were fathers? Students will discover this and other interesting dad-related data in our Father's Day Fun Facts handout. Check out our teaching guide for ideas on fun activities students can do using the handout, like writing a silly, comical, or sentimental poem about an important man (or person) or interview a father to find out what it’s like to be a dad.
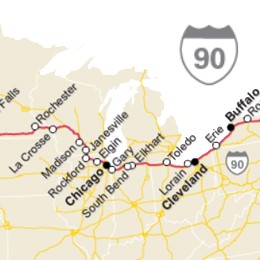
Anniversary of the Federal-Aid Highway Act – June 29
Did you know the United States highway system was built to meet the needs of a growing population that was traveling farther across the United States and to enable and the military to travel more efficiently? In recognition of this observance share our The Highway System—It’s Development and Impact on the United States high school history activity with students. They will examine a data visualization that displays 2010 Census data on population density along Interstate 90 and use these data to understand the effect of the National Interstate and Defense Highways Act of 1956 on American society.
Summer

What comes to mind when you think of summer? No school? Going to the beach? Family vacations? Test your knowledge with our Fireworks and Roads Trips Kahoot! game on a variety of summer-related topics powered by Census Bureau data like states with the most amusement parks or zoos and botanical gardens, to the number of U.S. travel agencies and RV campgrounds.
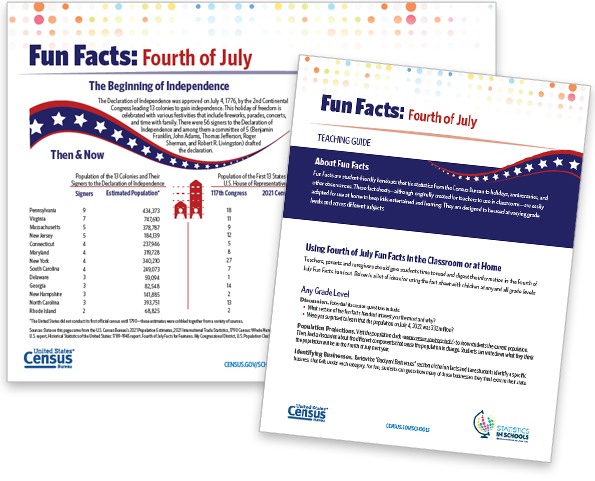
Celebrating Fourth of July
This day is filled with festivities across the nation from fireworks, parades and concerts to family gatherings and barbecues. Did you know approximately $396 million was the value of fireworks imported into the United States in 2023? Have a little fun with our Fourth of July Fun Facts handout that shares real-life data related to the holiday. The accompanying teaching guide is full of ideas on how to incorporate the data into classroom with activities from identifying businesses, bar graph practice to business proposal.
National Ice Cream Day – July 21

Celebrate National Ice Cream Day with a delicious treat and a few fun facts! Learn about the total number of ice cream and frozen dessert makers in your state with our State Facts for Students data tool. Students can compare their findings and discover how the numbers in their state compare to those in neighboring ones.
Activity of the Month
SIS has a variety of standards-based activities for all grade levels. In this section of our newsletter, an SIS staff member has handpicked one of their favorites for you to explore.
Discover the Meaning of Names and the Most Popular Surnames With Our Narrative and Names Elementary English Activity
What’s in a name? Plenty, as it turns out! Have your students review the most common U.S. last names and how they have changed over the years in this activity. The lesson provided serves as an introduction for students to complete a narrative writing assignment about their surname and its history. They will also examine and answer questions about census data on popular last names, listen to a story about names, and complete a Quickwrite about that story. To further prepare for their narrative writing assignment about names (which is not part of this activity), students will jot down their thoughts in a graphic organizer.
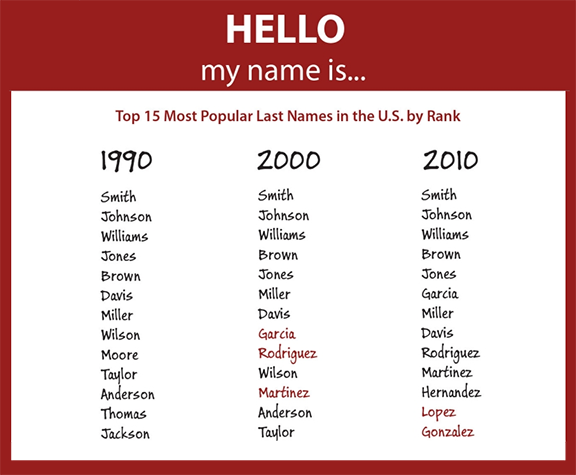
Why This Activity Is a Staff Favorite
Names are special! They are an important part of our identity and carry a deep family connection. In this activity students will be able to reflect on their own name using descriptive details as part of a creative writing exercise. They will also explore the most popular surnames in the United States over three decades using Census Bureau data, for example, Jones was the fourth most popular surname in 1990 and Brown moved from the fifth position in 1990 to the fourth in 2000 and 2010, replacing Jones, which fell to fifth. By reviewing the percentage increases and decreases of surnames, students will discover how the U.S. population changed over the decades. After completing this activity, students may have a better appreciation of not only their own name but a newfound respect for other people’s names as well. Stay tuned to see what the most popular surnames turns out to be for 2020!
Page Last Revised - June 6, 2024
✕
Is this page helpful?
 Yes
Yes
 No
No
 Yes
Yes
 No
No✕
NO THANKS
255 characters maximum
 255 characters maximum reached
✕
Thank you for your feedback.
Comments or suggestions?

Comments or suggestions?