
Official websites use .gov
A .gov website belongs to an official government organization in the United States.
Secure .gov websites use HTTPS
A lock (
) or https:// means you’ve safely connected to the .gov website. Share sensitive information only on official, secure websites.

Activities
Resources
Standards
About
Step into the New Year Using Real-Life Data in the Classroom
Happy New Year! Start off 2024 with a bang by enhancing your students’ statistical and civic literacy skills with Statistics in Schools (SIS) resources! From discovering the total number of kids ages 8 to 14 in your state to exploring census-related terms, SIS activities help boost students’ understanding and use of data well before they reach college. What better way to ring in the new year?
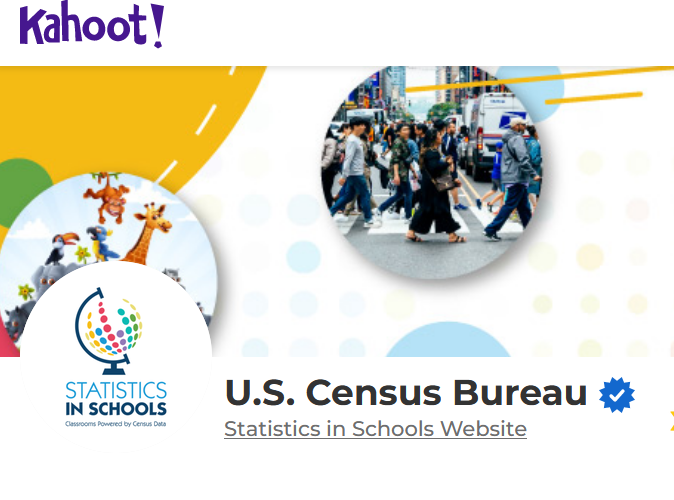
January 4 – National Trivia Day
Celebrate this day using the Census Bureau’s Kahoot! collection of games that improve and test students’ knowledge using real-life data about things like population, American history, U.S. businesses, education, and more. Students can explore fun topics like the average annual salary of workers with a bachelor’s degree and the top three states with the most chocolate makers. Who will come in first, second, and third?
January 6 – National Technology Day

It’s National Technology Day! Check out our Teachers' Guide to Data Access Tools for Students to discover a variety of tools you and your students can use to access data. Elementary and middle school students can explore the State Facts for Students data tool that looks at cool things like the total number of zoos and botanical gardens, fitness and recreational sports centers and more in your state. High school students can explore data using the Census Business Builder tool for demographic and economic data at the county, city, ZIP code and census tract level. A great way to recognize this day!
January 16 – Martin Luther King Jr. Day
Did you know that the percentage of Black or African American adults with a four-year college degree increased by about 24 percent from 1964 to 2020? Celebrate this day with students by sharing with them our elementary school history activity, I Have a Dream – Learning About Martin Luther King Jr., which includes key statistics like this and others such as changes in the U.S. population, voting rates and education levels of Americans since the early 1960s when Dr. Martin Luther King Jr. delivered his “I Have a Dream” speech.

January 29 – National Puzzle Day
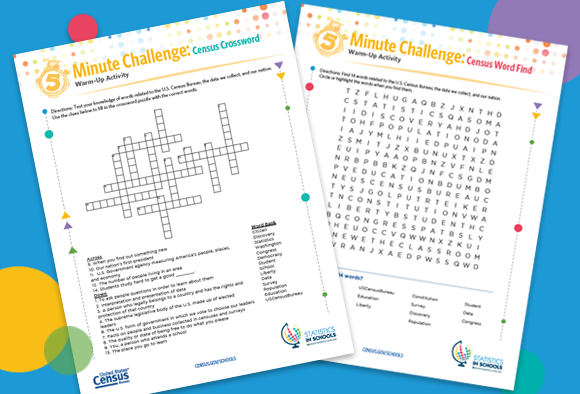
Happy National Puzzle Day! In honor of this day, share our Census Word Find and Crossword Warm-Up Activities with your students to teach them about census data and expand their vocabulary of census-related terms like population, education, survey, statistics, and more!
Activity of the Month
SIS has a variety of standards-based activities that students in all grade levels can use in the classroom. In this section of our newsletter, an SIS staff member has handpicked one of their favorites for you to explore.
Perceptions of a Place: Los Angeles, California
What is your perception of the world? Share this elementary school geography activity with your students to help them understand different perceptions of our ever-changing world and the places, regions, and environments in it. For this activity, students explore such data as median household income, and employment in the nation and in Los Angeles, California, to discover the roots of different world perceptions.
For example, one’s perception about Los Angeles may be that it is crowded. Looking at the data, in 2021 there were about 8,199 people per square mile in Los Angeles compared to 252 people per square mile in California and 94 people per square mile in the United States. In other words, there were more people per square mile in Los Angeles than in the rest of the state and country.

Plan ahead: Check out our National Hobby Month and National Spouses Day (January 26) resources, Black (African American) History Month Fun Facts, Valentine’s Day Fun Facts (February 14), and President’s Day Warm-up Activity (February 20) and use our Monthly Highlights page to plan your month!
Page Last Revised - January 4, 2024
✕
Is this page helpful?
 Yes
Yes
 No
No
 Yes
Yes
 No
No✕
NO THANKS
255 characters maximum
 255 characters maximum reached
✕
Thank you for your feedback.
Comments or suggestions?

Comments or suggestions?