February Eyes Love, Heritage, and Public Education
February Eyes Love, Heritage, and Public Education
This month, Statistics in Schools has assembled educational resources related to African American (Black) history, Valentine’s Day, Public Schools Week, and more! Discover tools and activities using Census Bureau data on such topics as occupations held by African Americans, the two states with the most chocolate makers, and the relationship between income and education levels.
Recognizing Black History Month
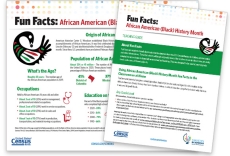
Did you know that there are an estimated 41 million African Americans in the United States, and that Bessie Coleman was the first Black person to earn an international pilot’s license and the first Black woman to hold a pilot’s license? Commemorate the month with our African American History Fun Facts handout, which includes statistics about the median age, education levels, birthplace populations of famous African Americans, and more. The accompanying teaching guide provides activities you can do with your students using our fun facts to expand their knowledge about this population.
Celebrate Frozen Yogurt Day - February 6
There are 441 ice cream and frozen dessert makers in the United States. Discover how many of them are in your state using the Census Bureau’s State Facts for Students data tool.Students can also explore other cool facts about their state and compare them to those in neighboring states. Don’t forget to have a yummy frozen treat and share what you discover about your state with a friend!
Spreading Love With Statistics on Valentine’s Day
Happy Valentine’s Day! Roses are red and violets are blue, which one of the 12,000 U.S. flower shops sent a bouquet to you? Download our Valentine’s Day Fun Facts handout to discover other fascinating nuggets about this romantic holiday like places with the loveliest names and the value of flower imports. The accompanying teaching guide offers great ways to celebrate this day with students and get them excited about statistics!
Happy Public Schools Week – February 21 -25
Did you know that in 2019, high school was the highest level of education completed by 28.1% of the population ages 25 and older? As we recognize Public Schools Week, share our Fitting a Line to Data - Earnings and Educational Attainment activity with your middle school students. This activity examines the relationship between earnings and levels of educational attainment. Students create a scatter plot relating median annual income to years of education and draw inferences on its impact.


