Recognizing Legacies, Lincoln and Love in February
This month explore activities with U.S. Census Bureau data related to African American (Black) History Month, Abraham Lincoln, and Valentine’s Day. Have fun with statistics and learn about the total population of African Americans, U.S. cities and towns with the loveliest names, and how President Lincoln used a statistical map to help navigate one of the most pivotal times in U.S. history.
African American (Black) History Month

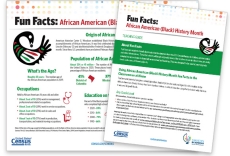
Statistics in Schools is excited to share new fun-filled resources for Black History Month. Did you know that approximately 3 out 10 or 32% of African Americans 16 years and older work in management, professional and related occupations? Share this and other interesting info in our Fun Facts handout with students about Black History Month like the population of the birthplaces of famous African Americans.

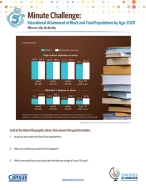
Then, take it a step further with our five-minute challenge to test your students’ analytics skills with an infographic on the educational attainment of African Americans by age. This and other easy-to-use activities (in our teaching guide) are a great way to interact with students in recognition of this month’s events.
Maps and Politics

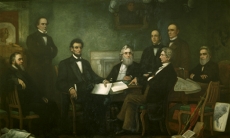
In celebration of Lincoln’s birthday on February 12th, learn how he and Union forces used a population density map of enslaved people in the Southern United States to help Americans understand the social implications of slavery. This was the first time in U.S. history that a statistical map was used for this purpose. This activity, aimed at high school students, provides a chance for students to analyze and interpret a historical map and see how decision-makers like President Lincoln likely used the map during the Civil War.
Valentine's Day Love is in the Air

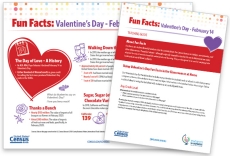
Happy Valentine’s Day! Express your love with statistics. There are about 12,361 flower shops in the United States. Oh, but there’s more! There’s data about marriage, candy, jewelry stores and then some in our Valentine’s Day Fun Facts handout that you can share with students – and turn into activities thanks to our complimentary teaching guide.


